MONITORING K8S: FOLLOW THE DATA DANIEL MAHER, DATADOG @phrawzty
Slide 1
Slide 2

- TRENDS IN CONTAINERISATION 2. THE QUALITIES OF GOOD METRICS 3. SCALING KUBERNETES (W/ METRICS)
Slide 3

DANIEL MAHER D O C S & TA L K S D E V O P S D AY S G R E AT O U T D O O R S GOURMAND SUITS FOR NO REASON @phrawzty
Slide 4

D ATA D O G SAAS-BASED MONITORING T R I L L I O N S O F P O I N T S / D AY WE’RE HIRING: w w w. d a t a d o g h q . c o m / c a r e e r s @datadoghq
Slide 5
Slide 6
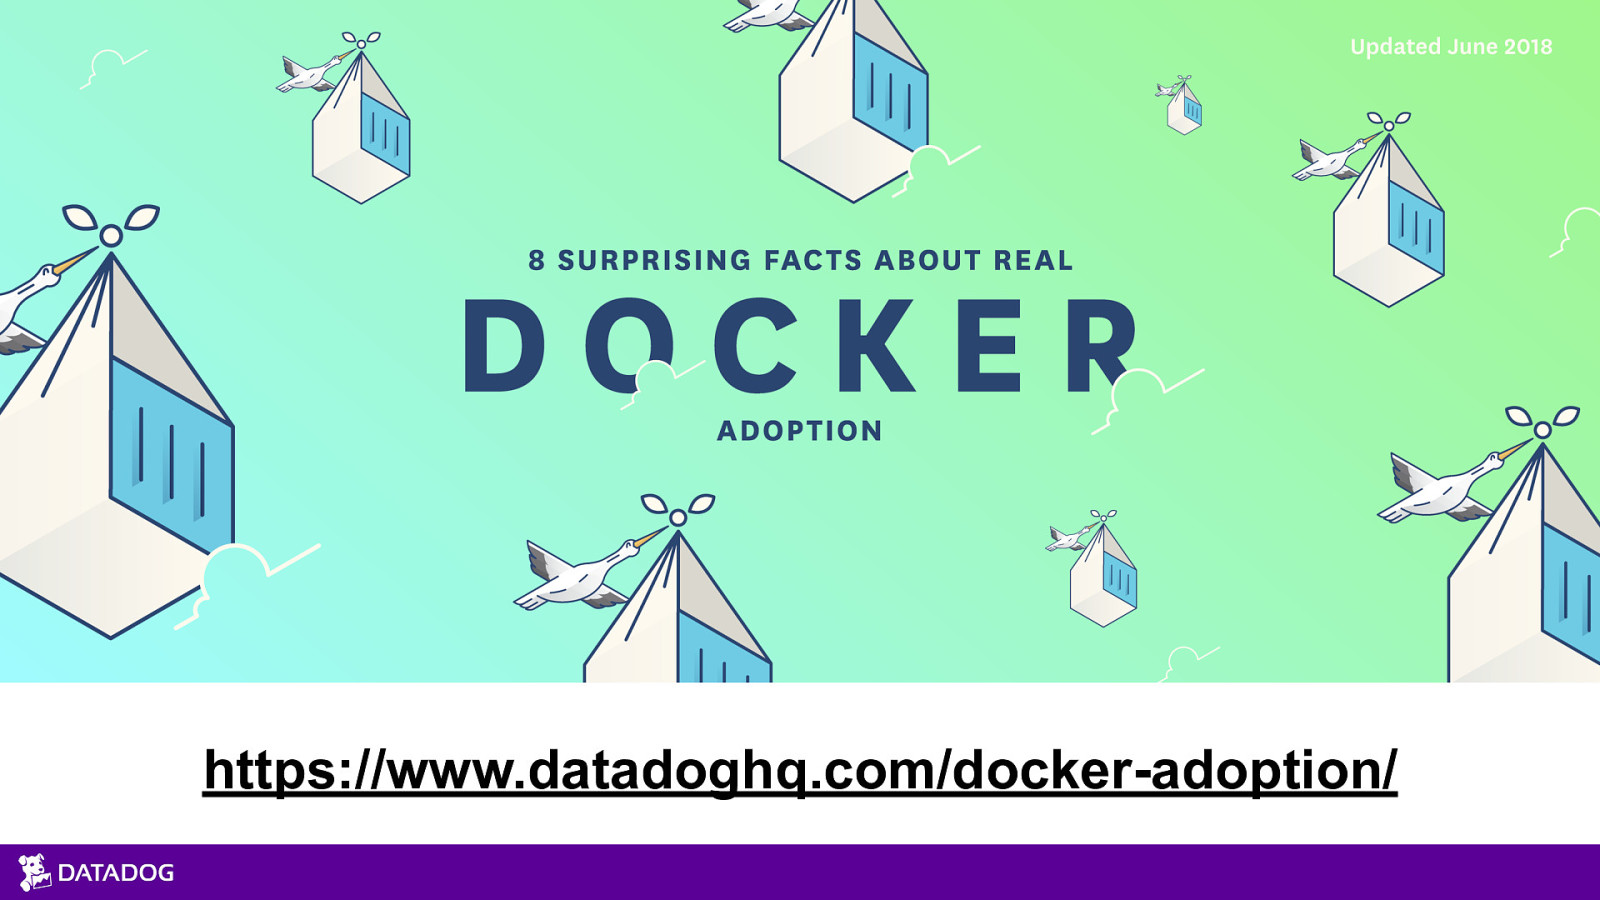
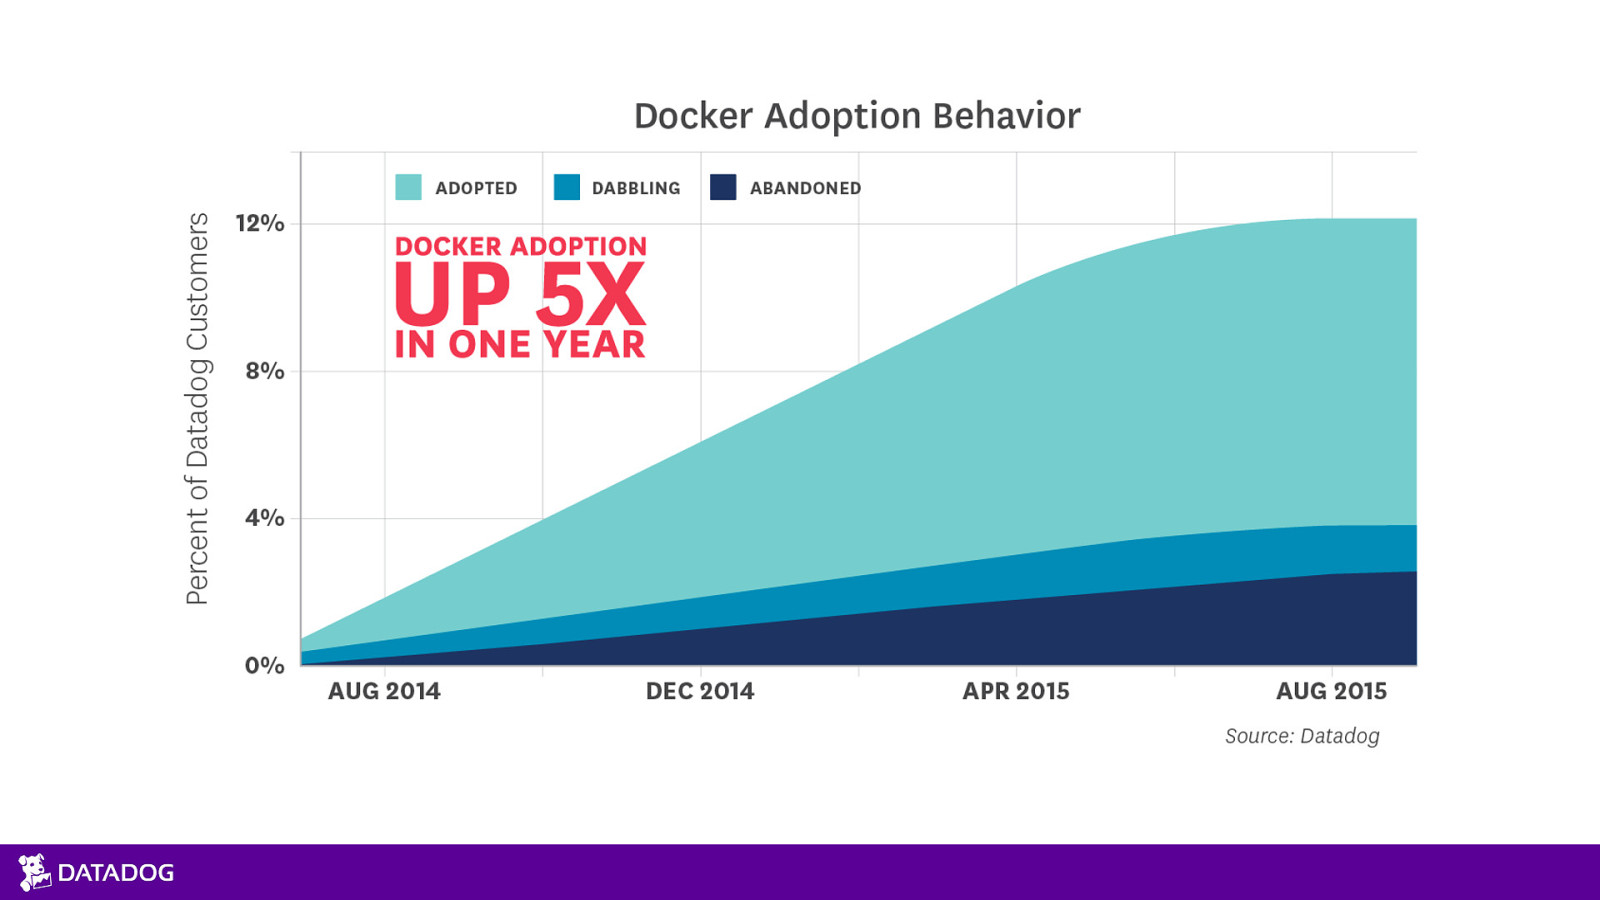
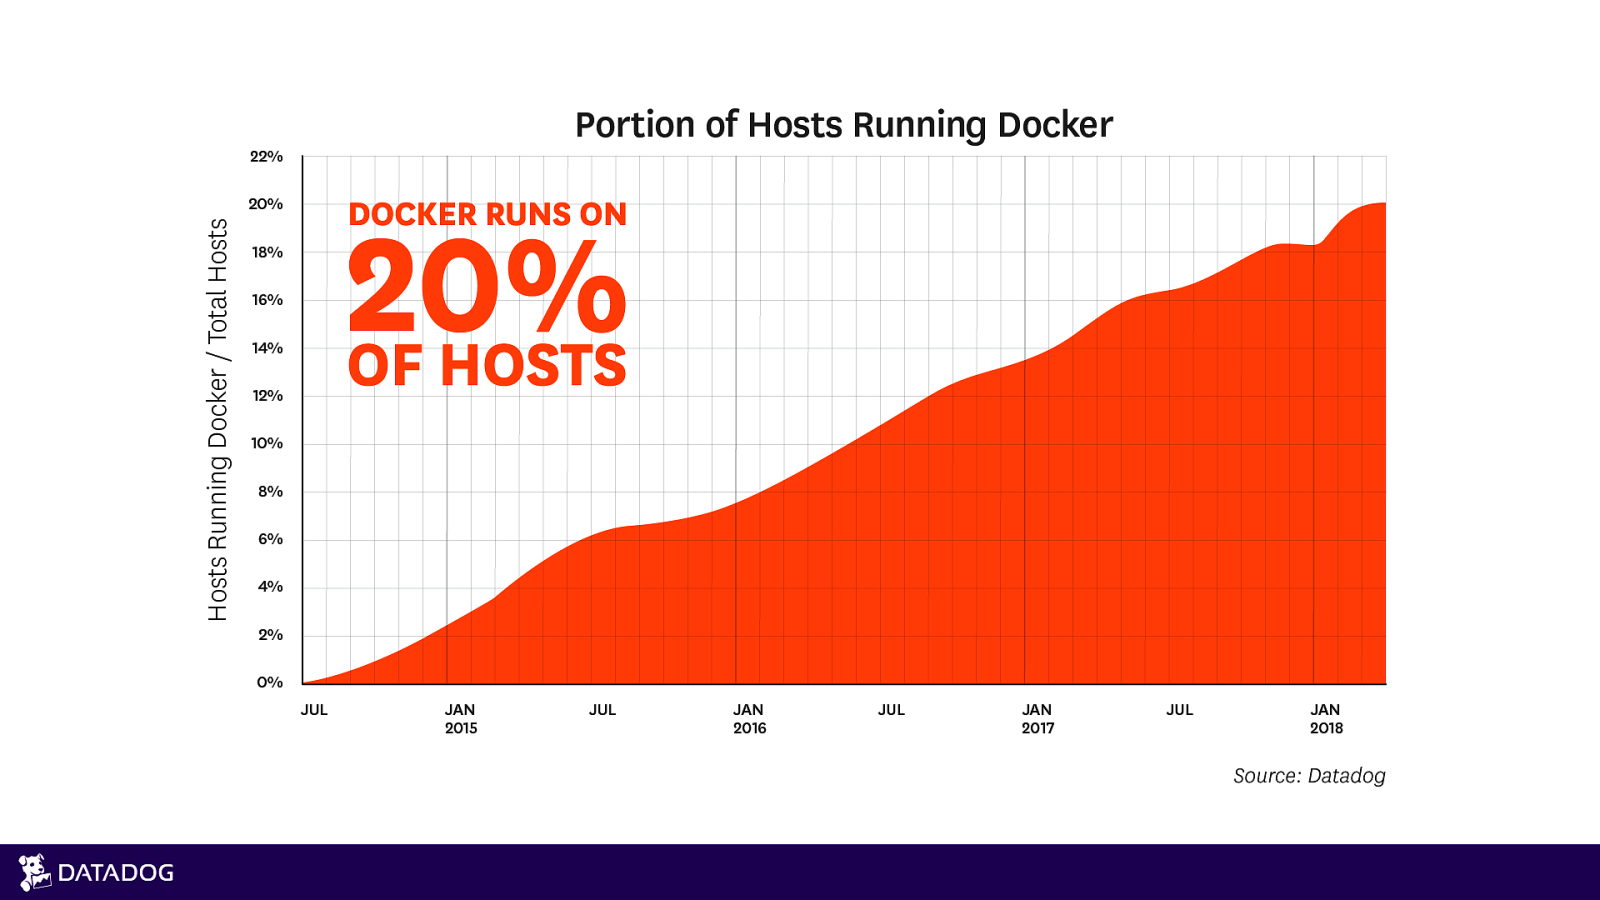
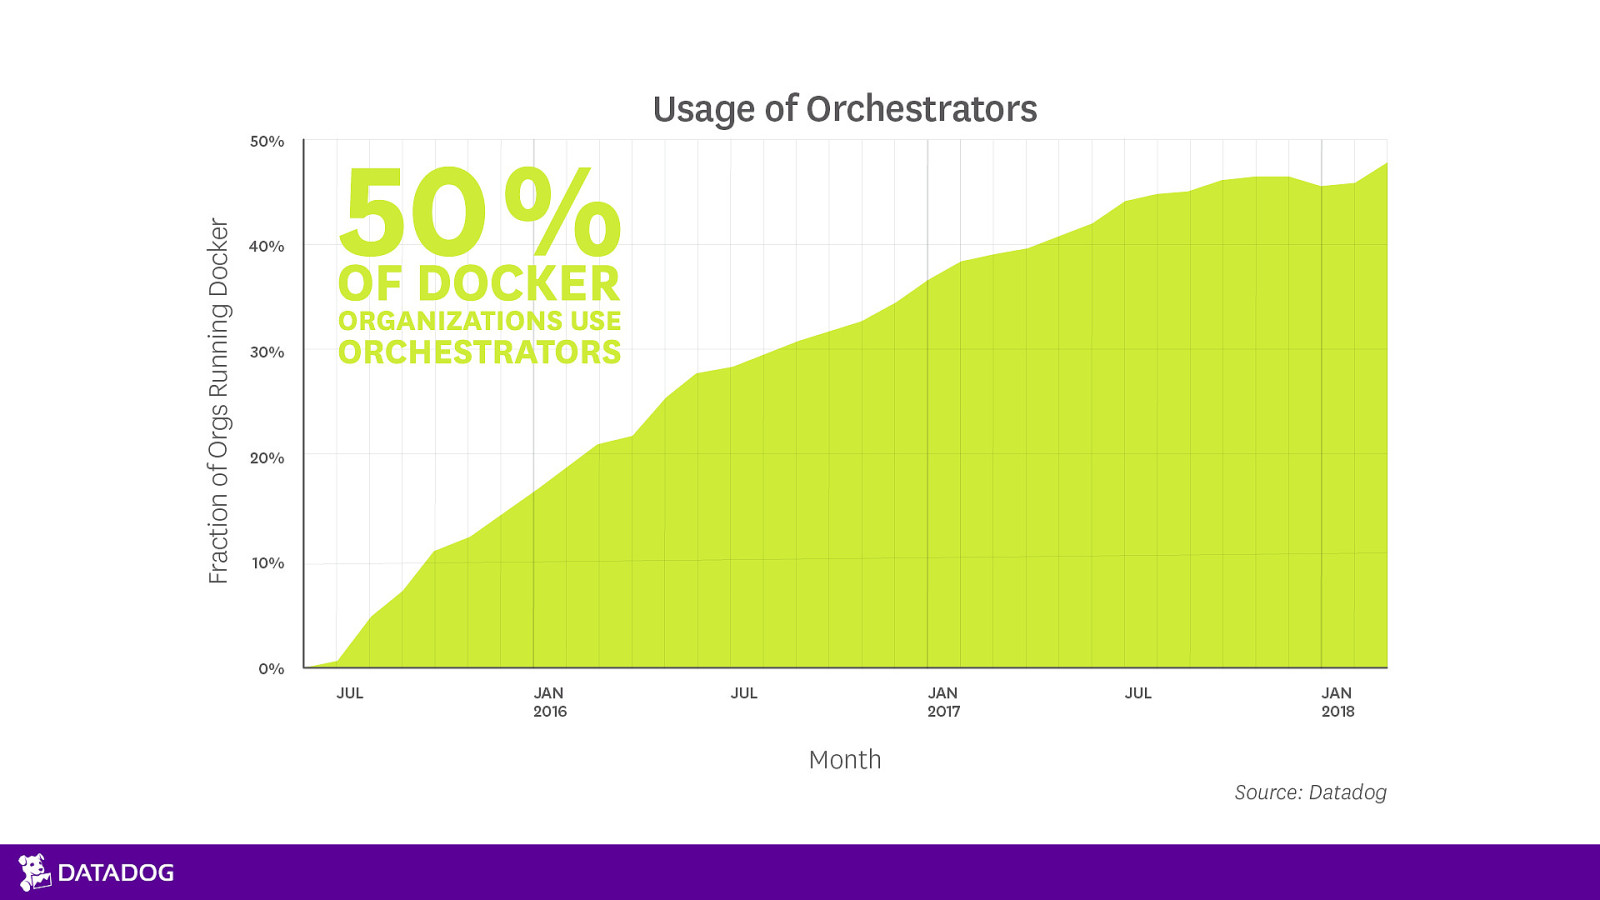
https://www.datadoghq.com/docker-adoption/
Slide 7
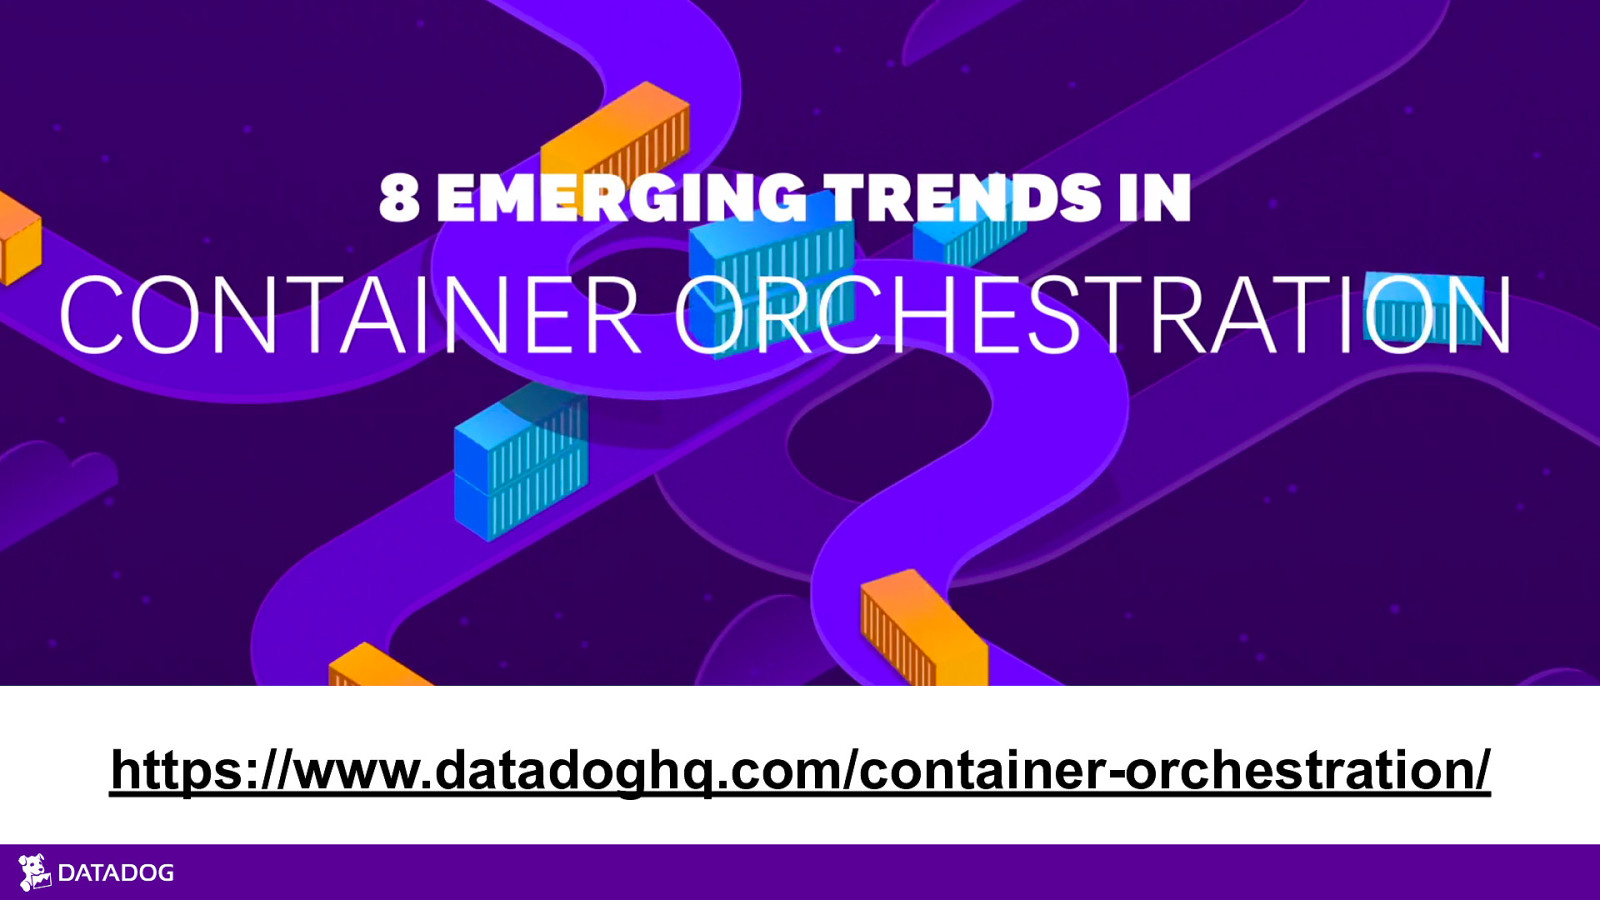
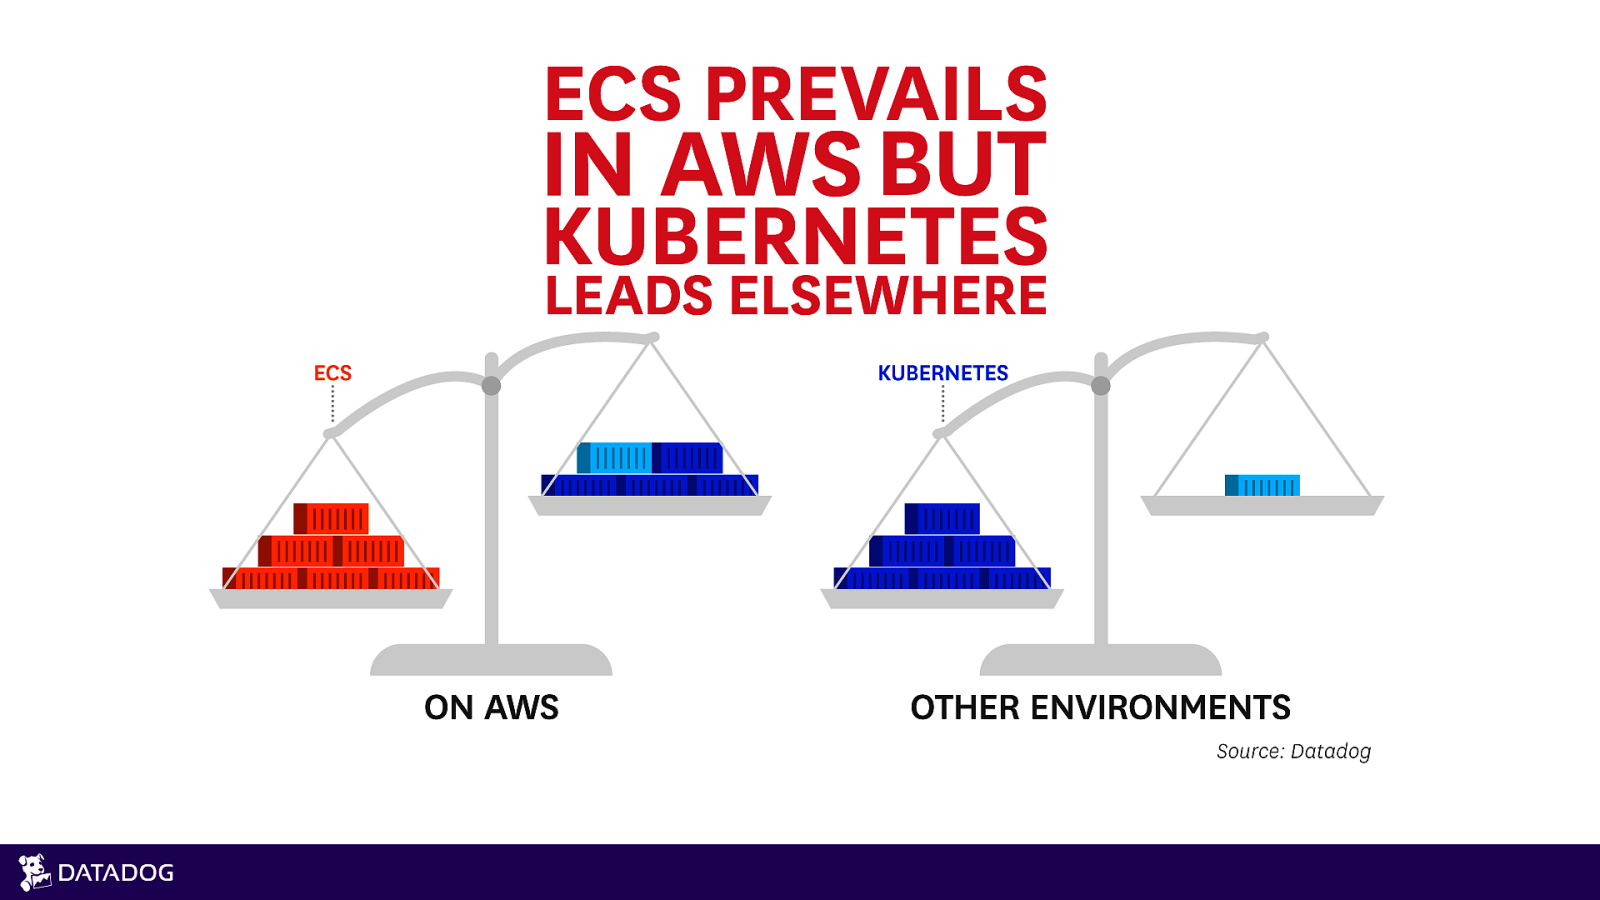
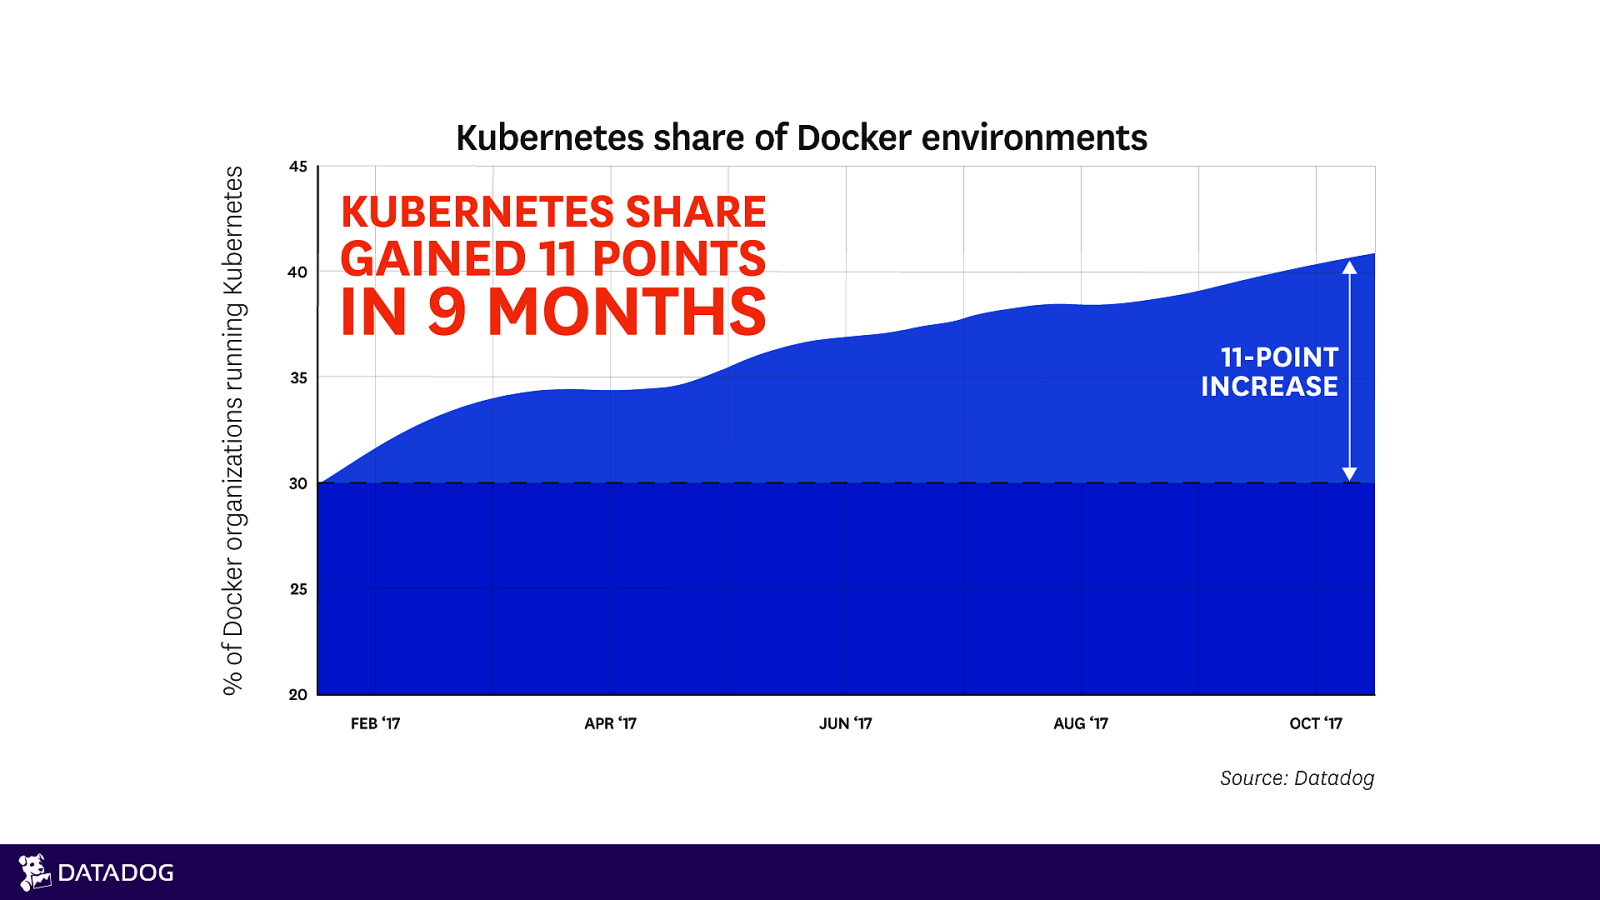
https://www.datadoghq.com/container-orchestration/
Slide 8
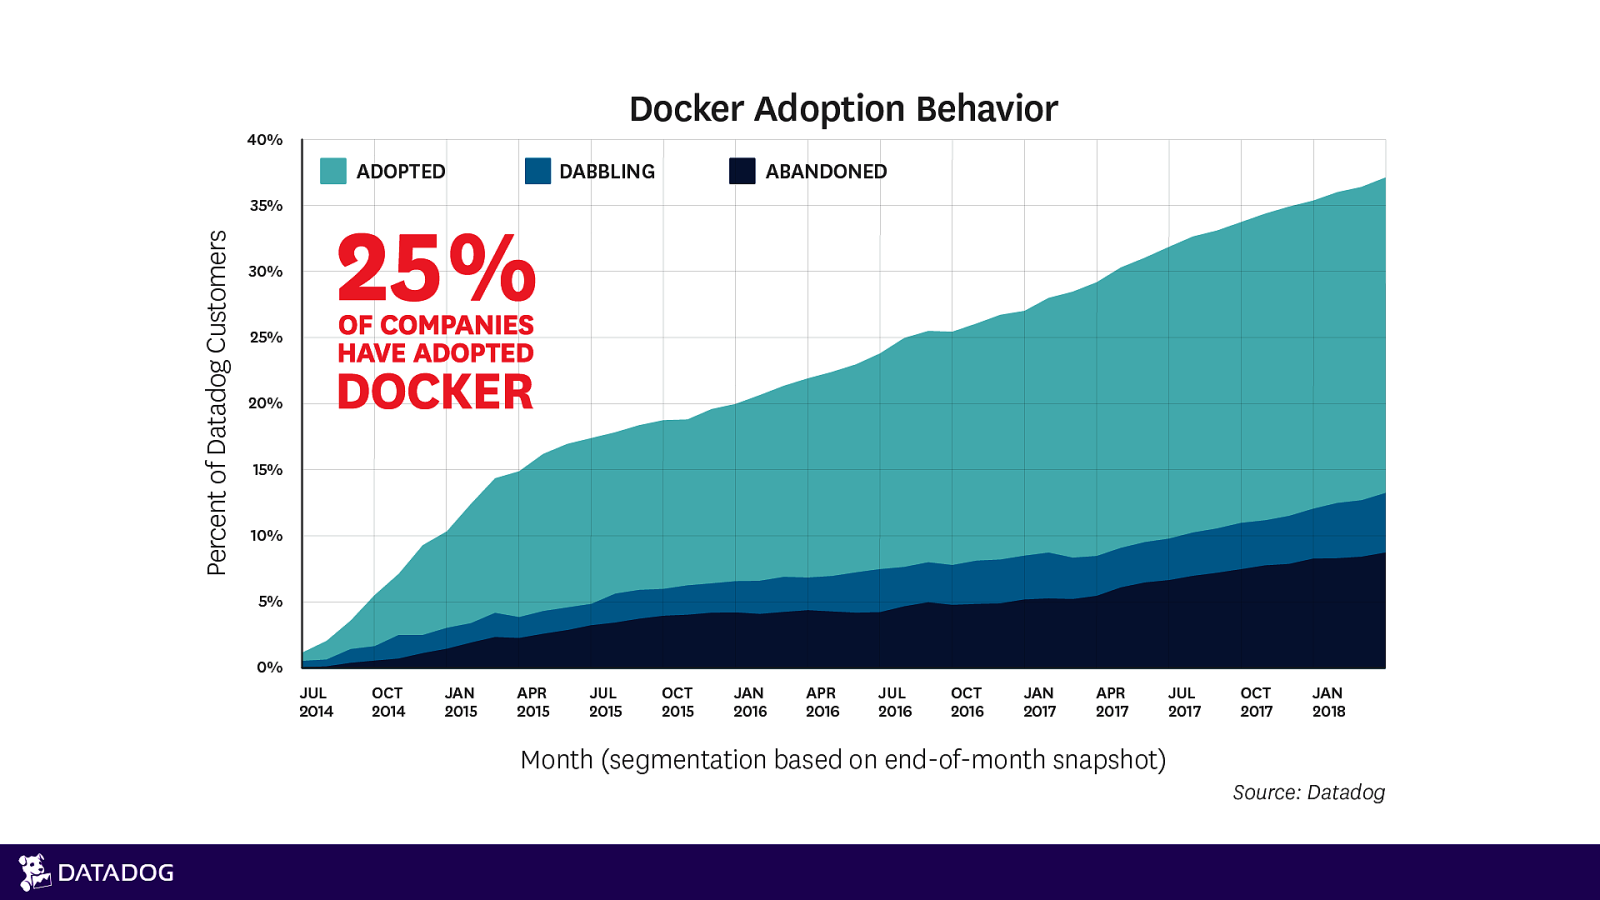
Docker Adoption Dabbler: used Docker during a given month, but hadn’t reached significant use as defined by Adopter.
Slide 9
Docker Adoption Dabbler: used Docker during a given month, but hadn’t reached significant use as defined by Adopter. Adopter: the average number of containers running during the month was at least 50% the number of distinct hosts run, or there were at least as many distinct containers as distinct hosts run during the month.
Slide 10
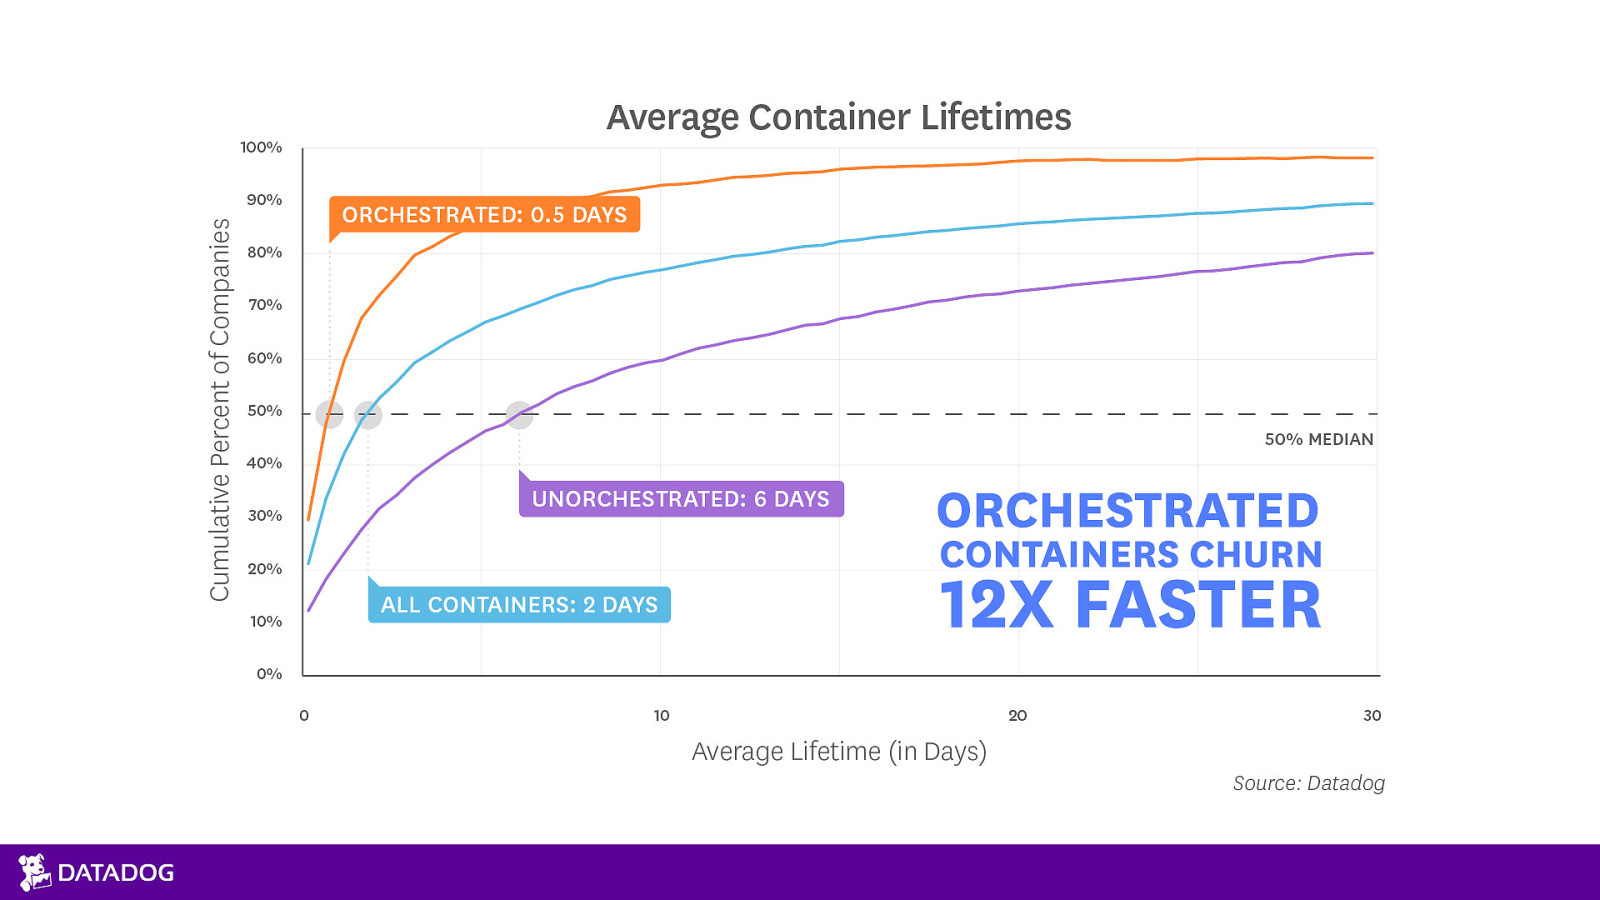
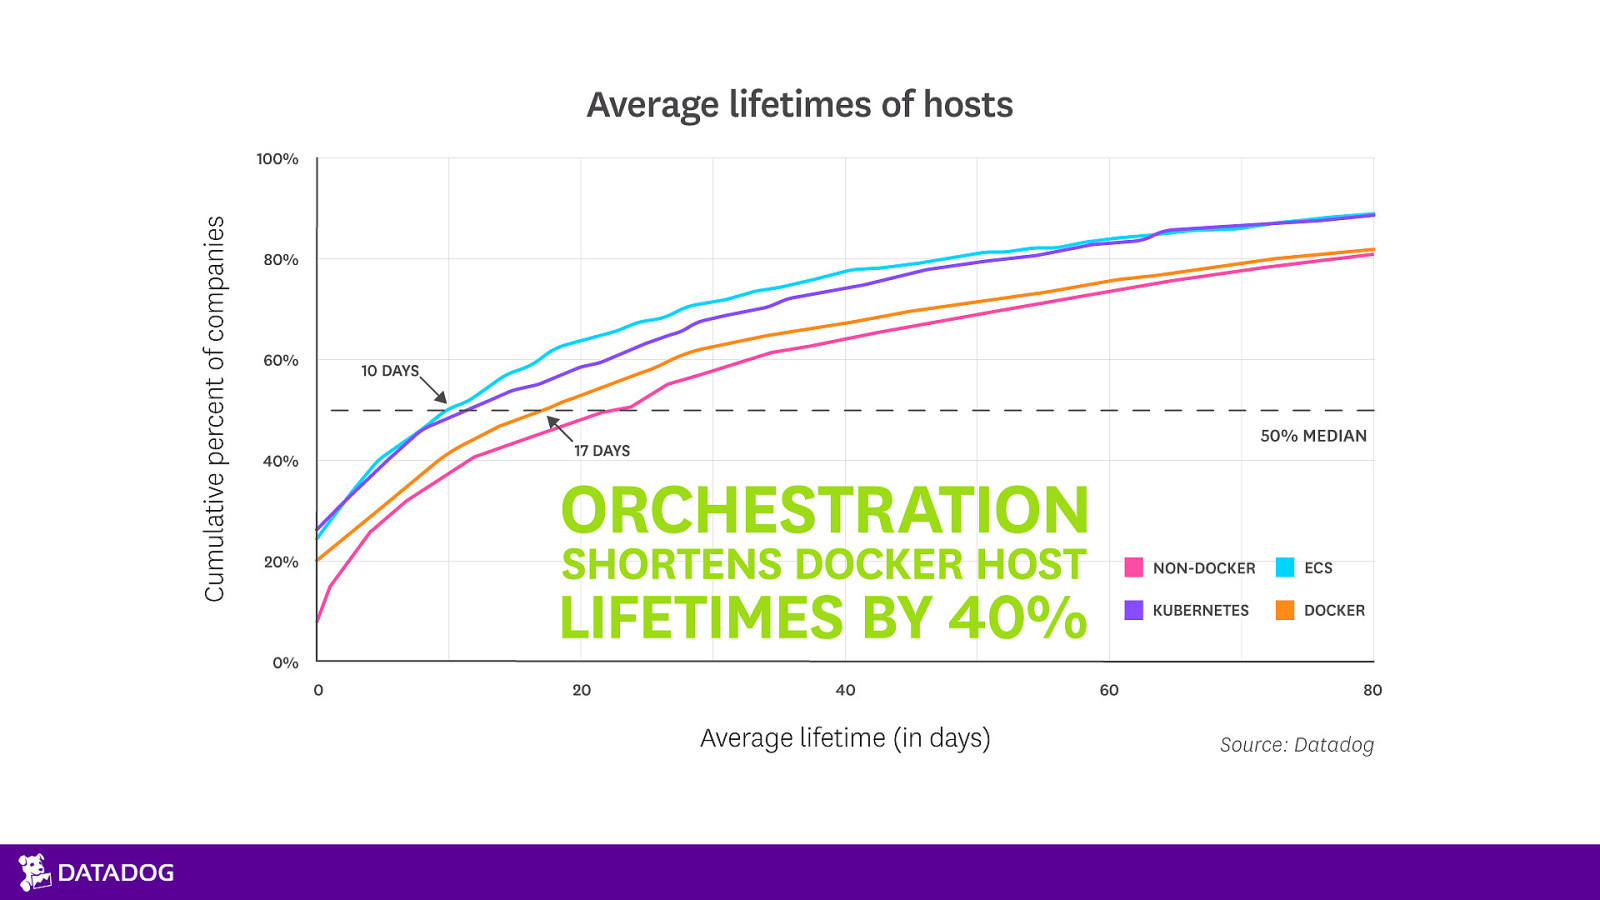
Docker Adoption Dabbler: used Docker during a given month, but hadn’t reached significant use as defined by Adopter. Adopter: the average number of containers running during the month was at least 50% the number of distinct hosts run, or there were at least as many distinct containers as distinct hosts run during the month. Abandoner: a currently active company that used Docker in the past, but hasn’t used it at all in the last month.
Slide 11
Slide 12
Slide 13
Slide 14

WHAT’S RUNNING?
Slide 15
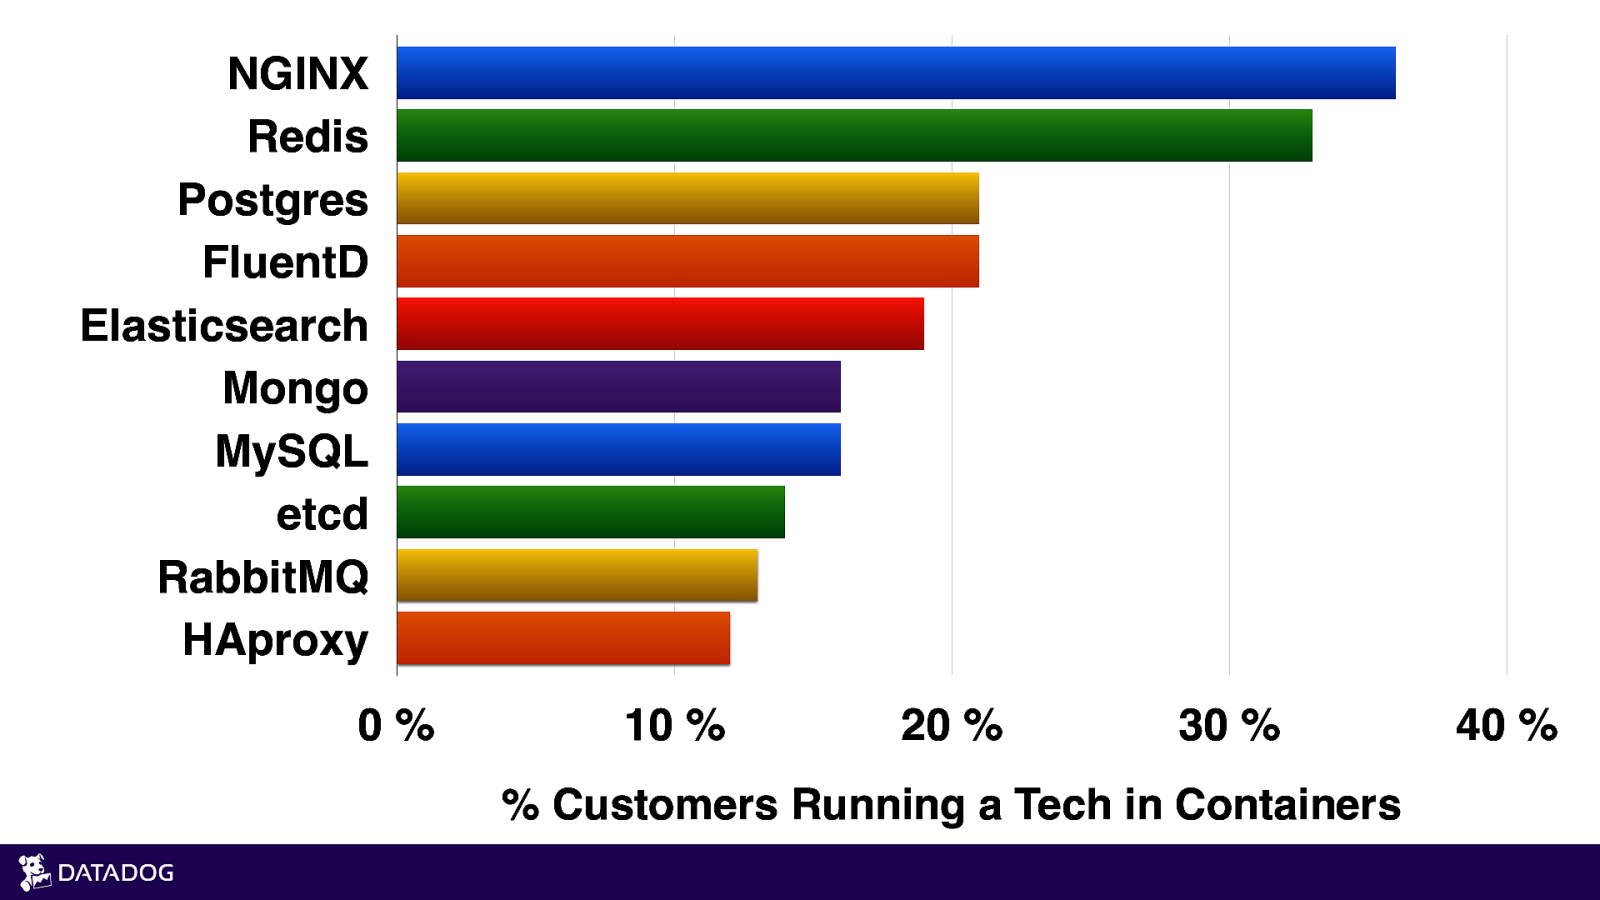
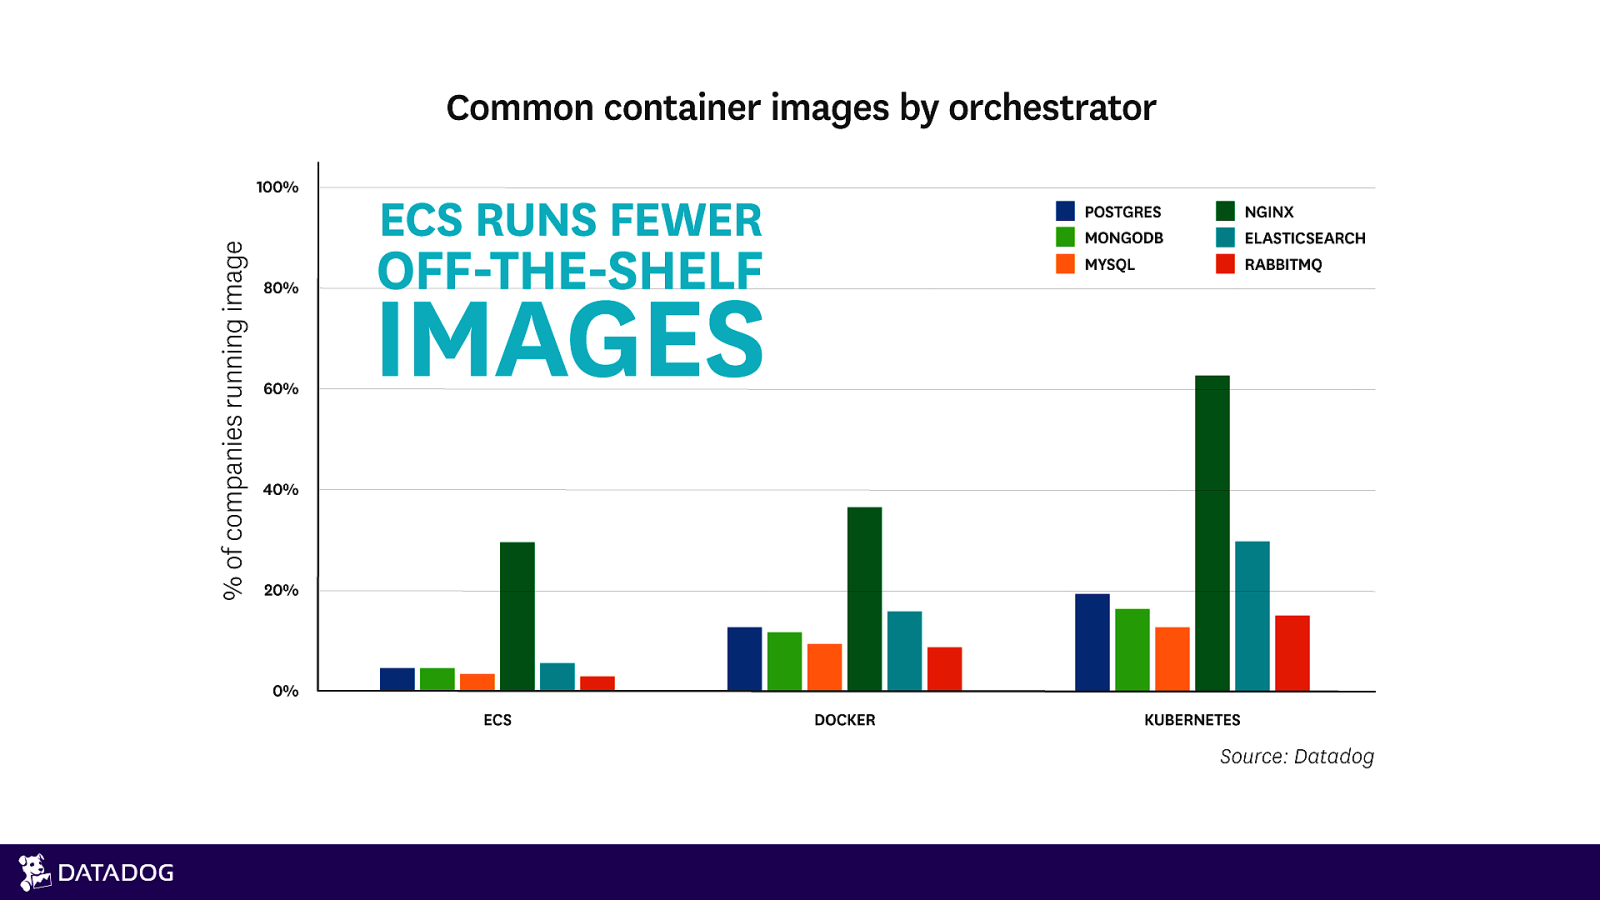
NGINX Redis Postgres FluentD Elasticsearch Mongo MySQL etcd RabbitMQ HAproxy 0% 10 % 20 % 30 % % Customers Running a Tech in Containers 40 %
Slide 16
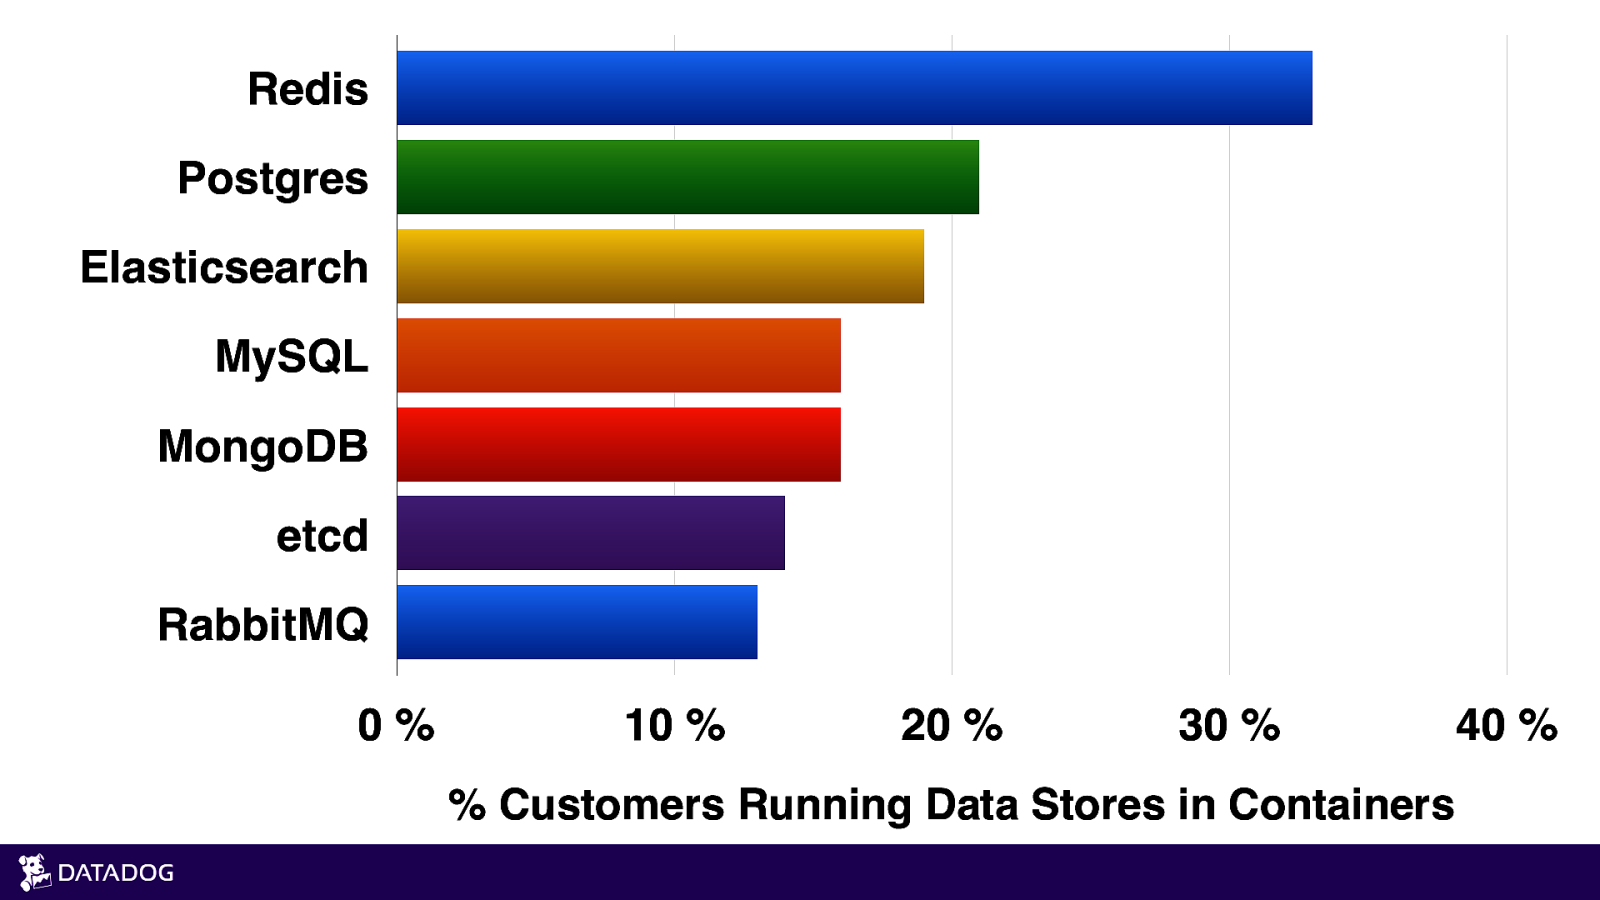
Redis Postgres Elasticsearch MySQL MongoDB etcd RabbitMQ 0% 10 % 20 % 30 % % Customers Running Data Stores in Containers 40 %
Slide 17

ENTER: ORCHESTRATION
Slide 18
Slide 19
Slide 20
Slide 21
NEW CONTAINER: WHO DIS?
Slide 22
Slide 23
Slide 24

WHAT’S RUNNING? PART 2: THE RUNNINATING
Slide 25
Slide 26

Slide 27
4 QUALITIES OF GOOD METRICS NOT ALL METRICS ARE EQUAL
Slide 28
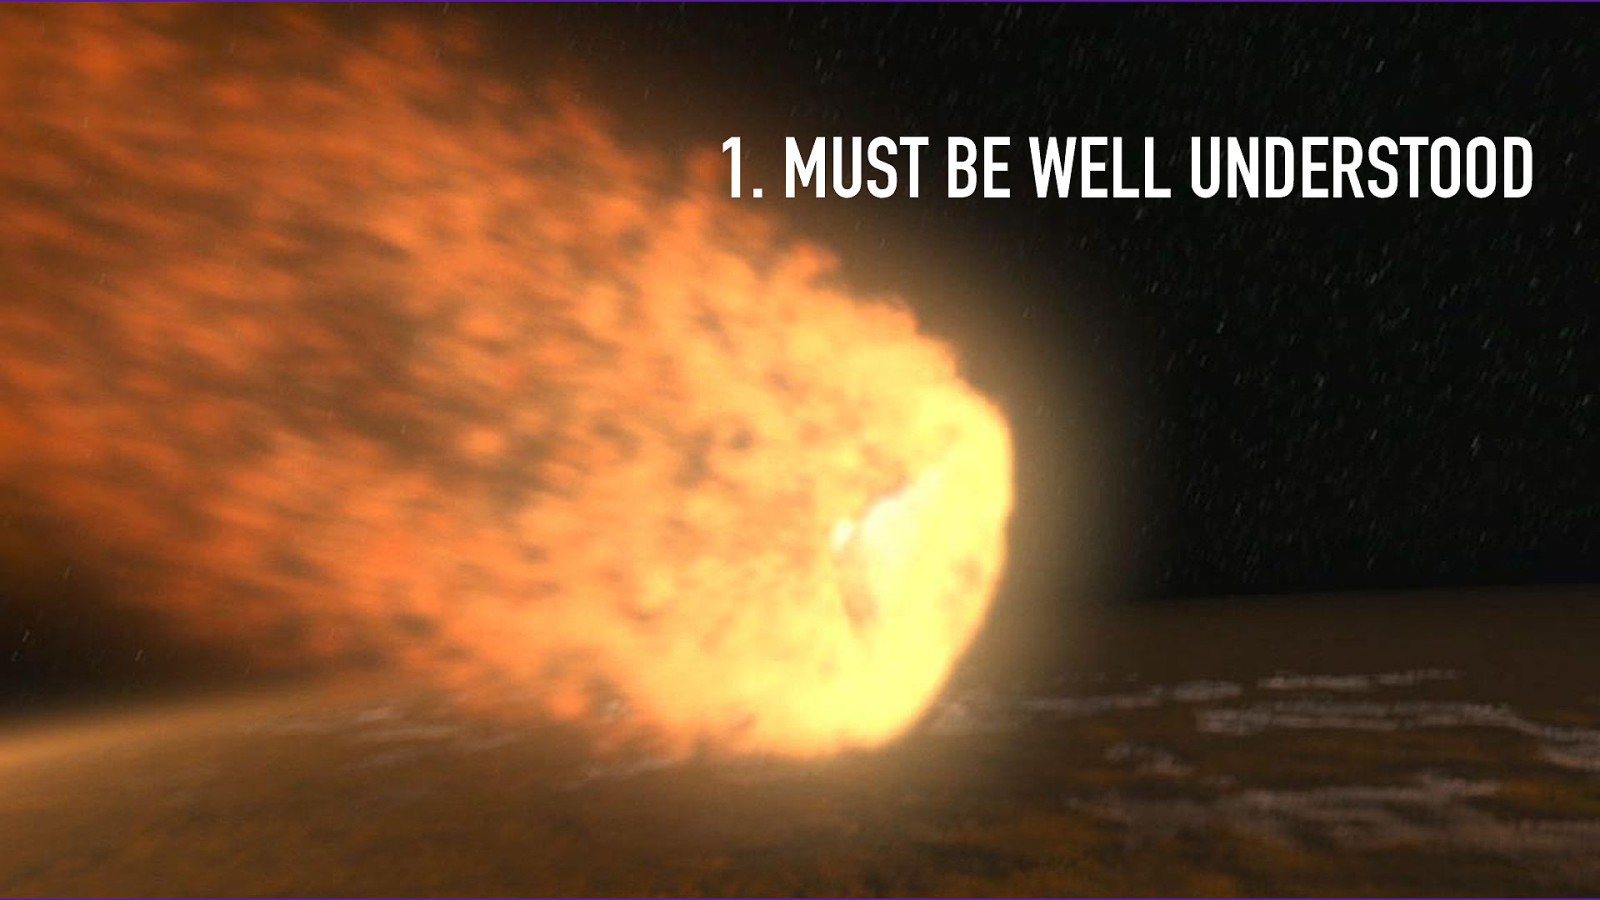
- MUST BE WELL UNDERSTOOD
Slide 29

- SUFFICIENT GRANULARITY
Slide 30
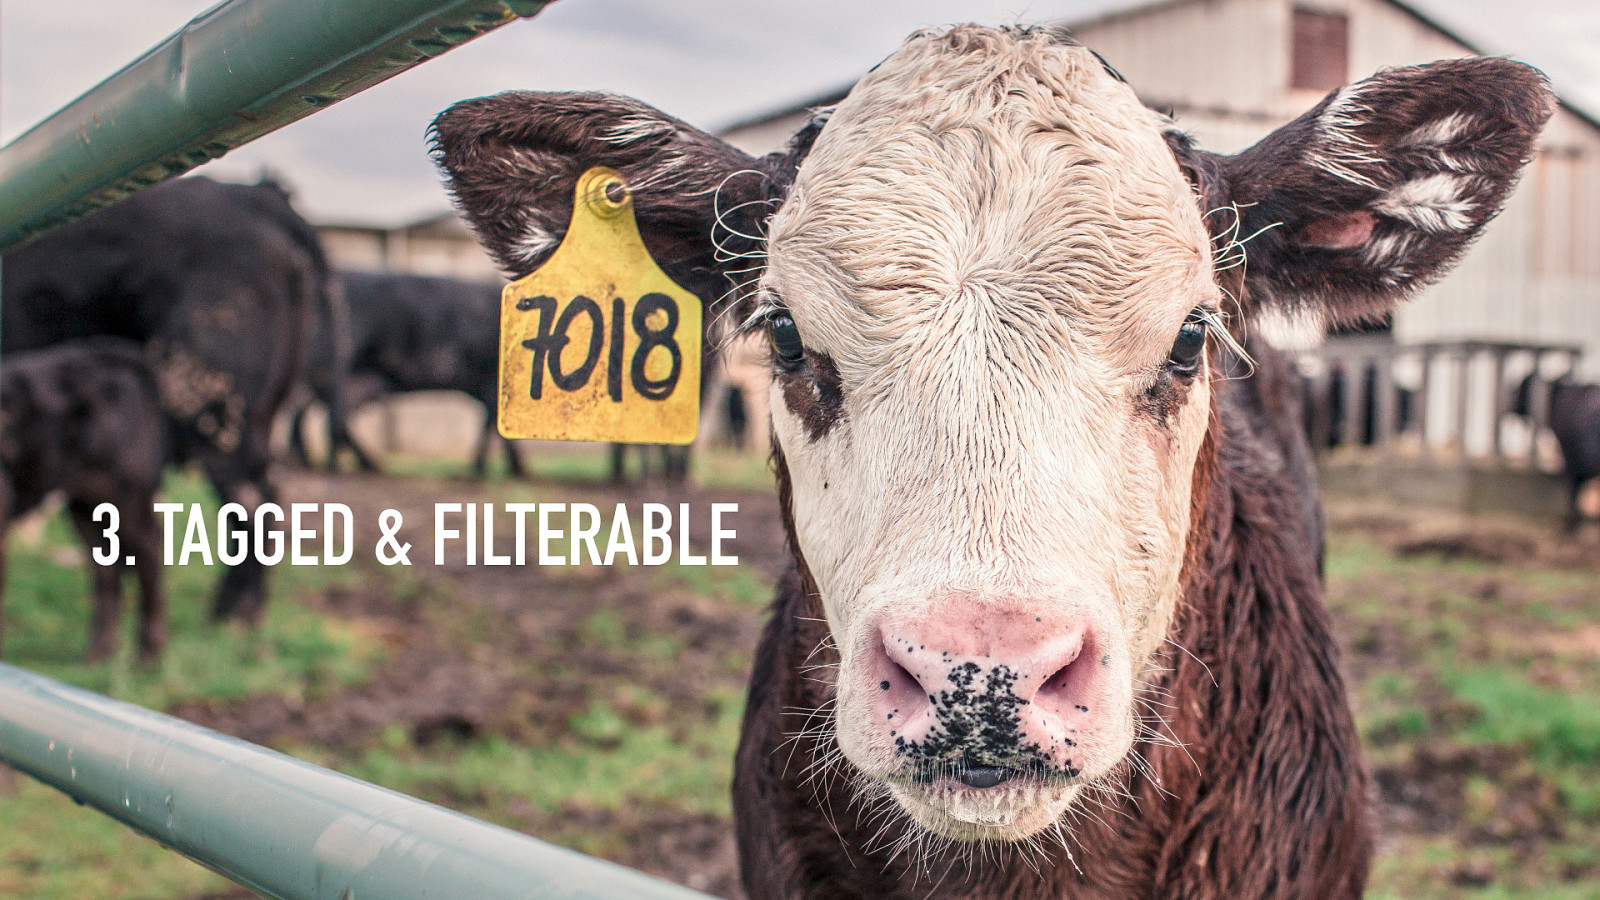
- TAGGED & FILTERABLE
Slide 31
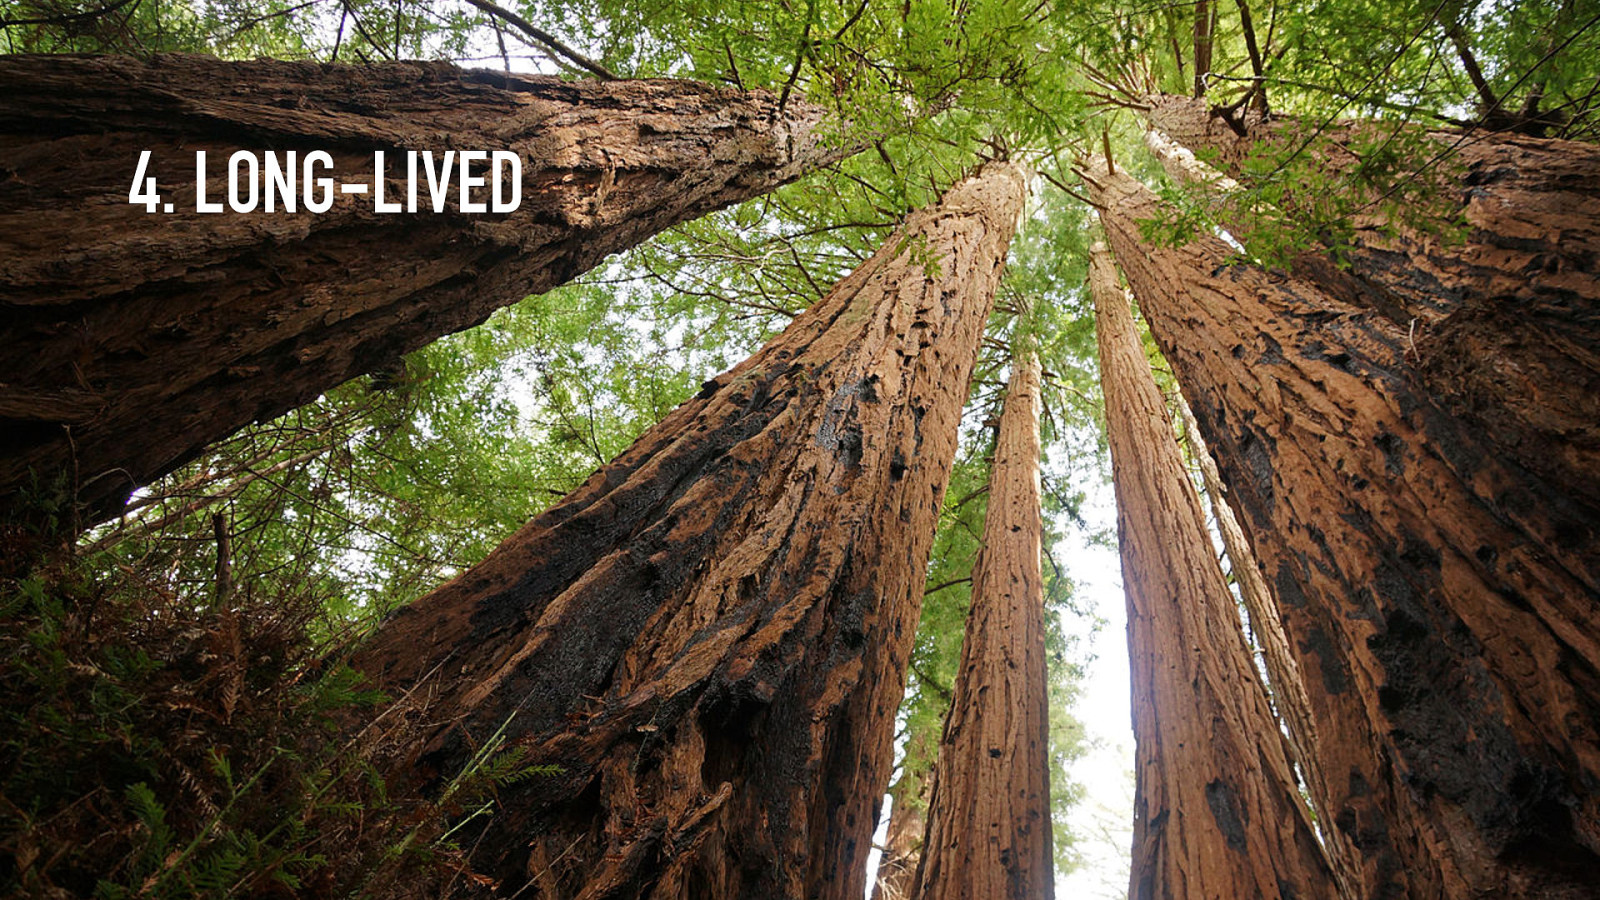
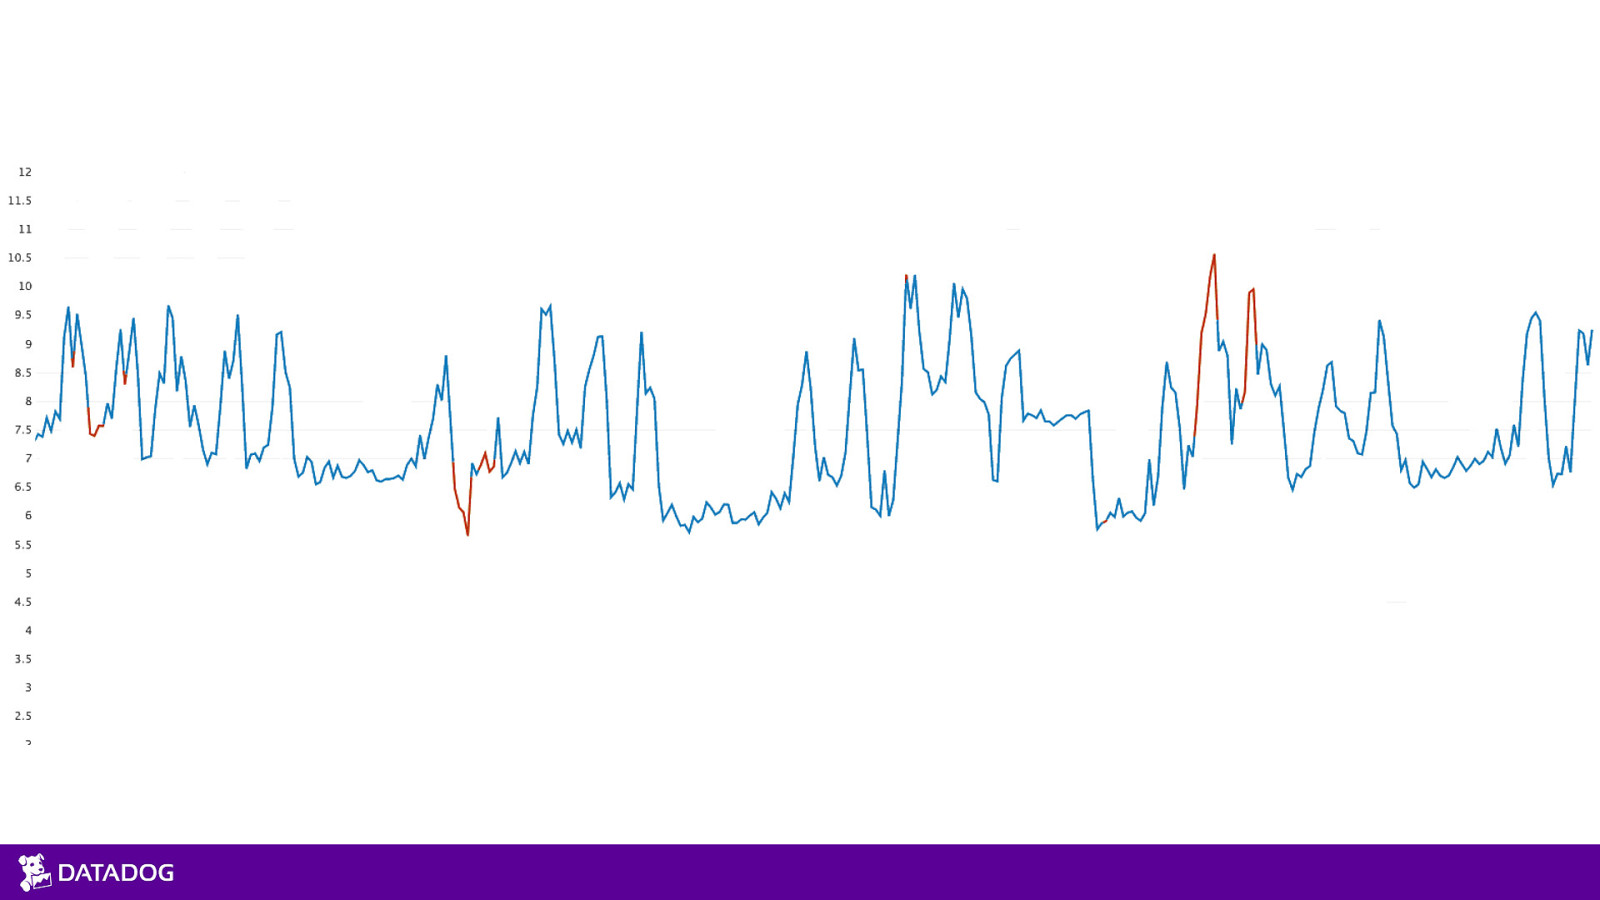
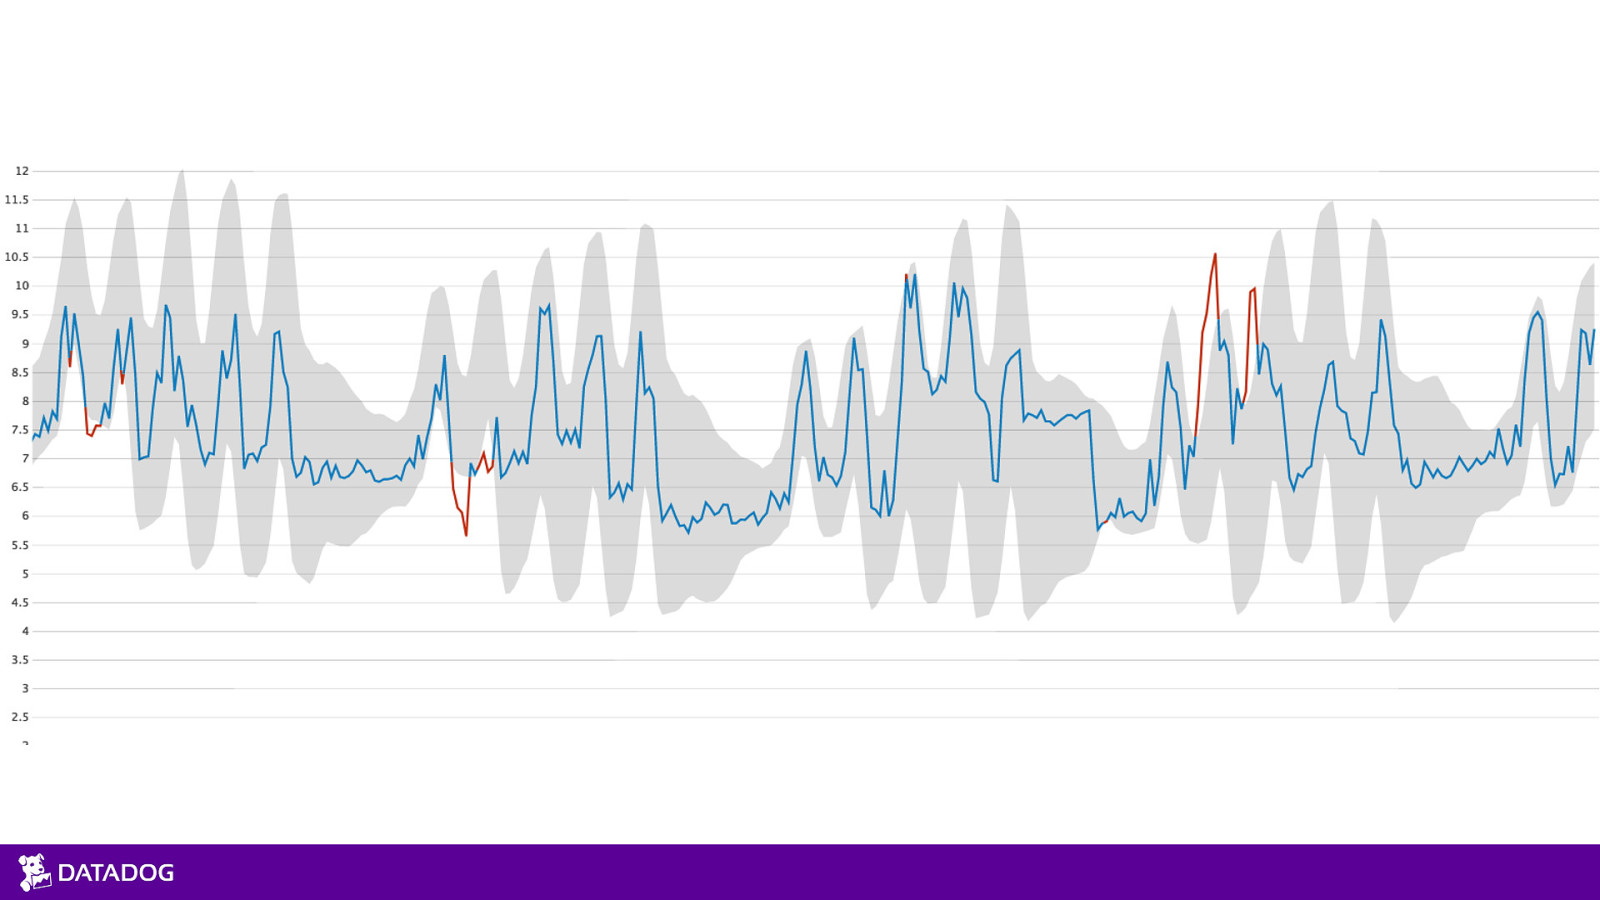
- LONG-LIVED
Slide 32
CUSTOM METRICS & K8S
Slide 33
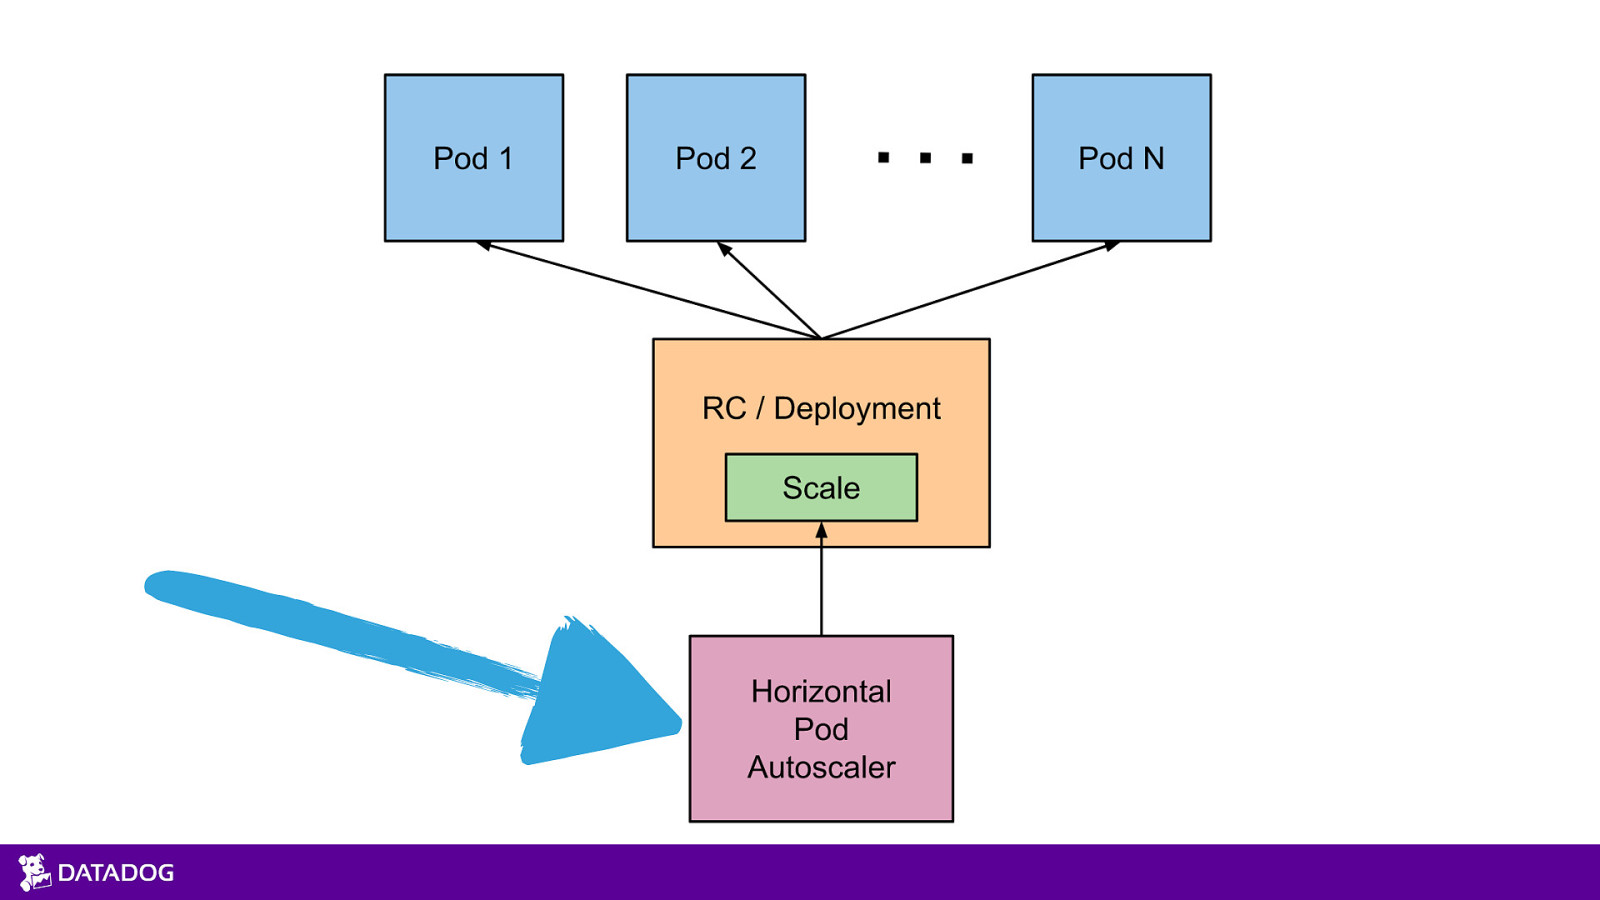
Slide 34
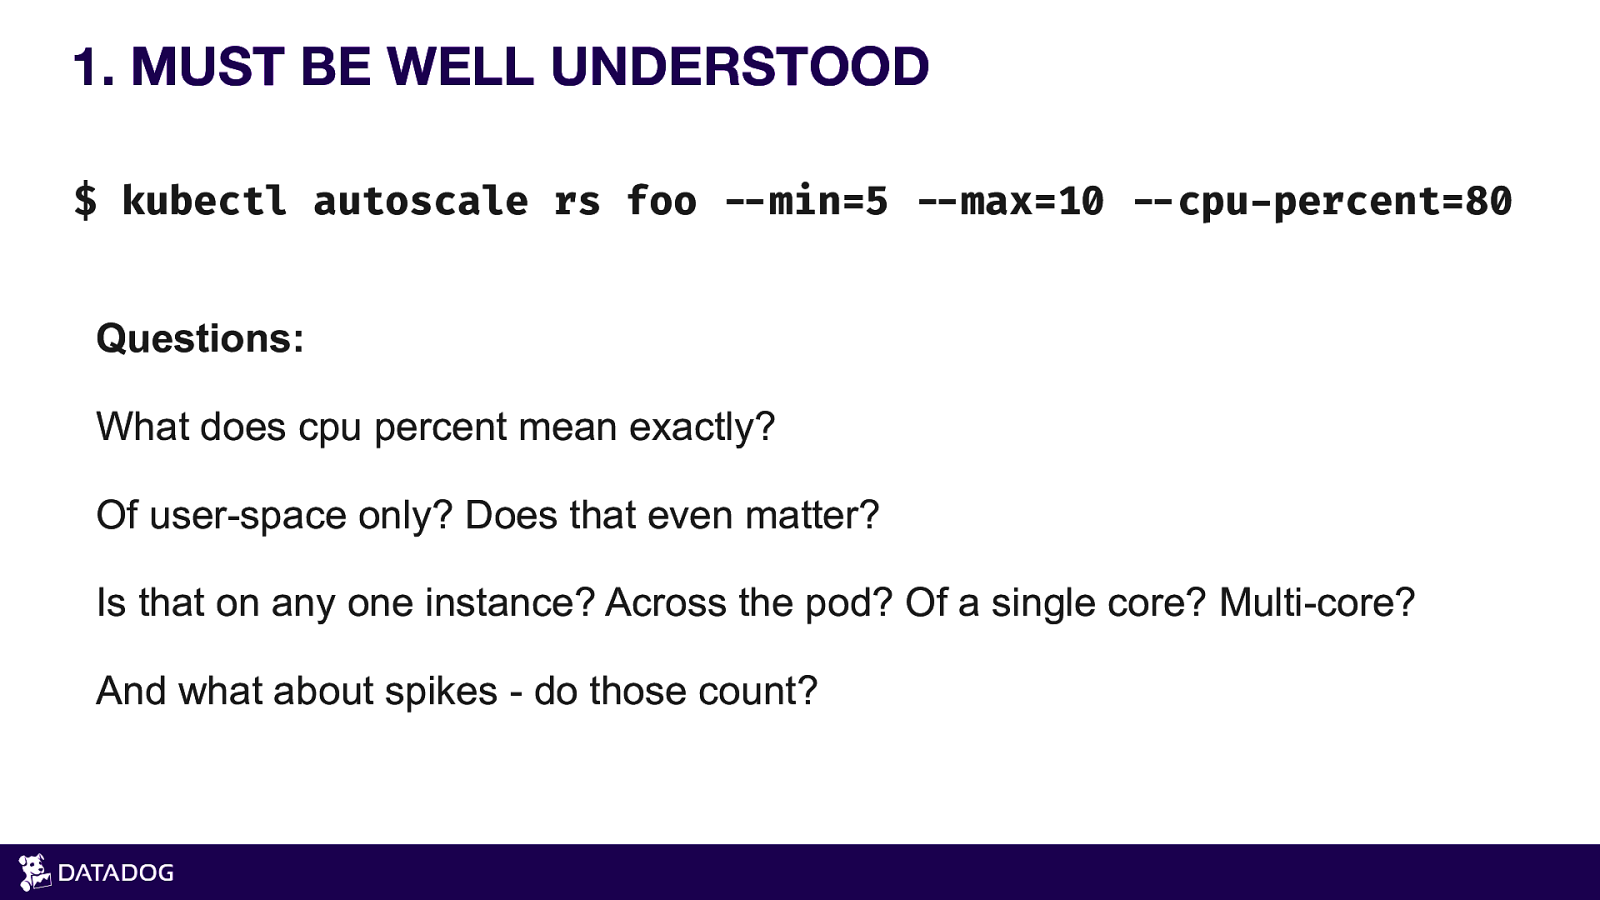
- MUST BE WELL UNDERSTOOD $ kubectl autoscale rs foo !—min=5 !—max=10 !—cpu-percent=80 Questions: What does cpu percent mean exactly? Of user-space only? Does that even matter? Is that on any one instance? Across the pod? Of a single core? Multi-core? And what about spikes - do those count?
Slide 35
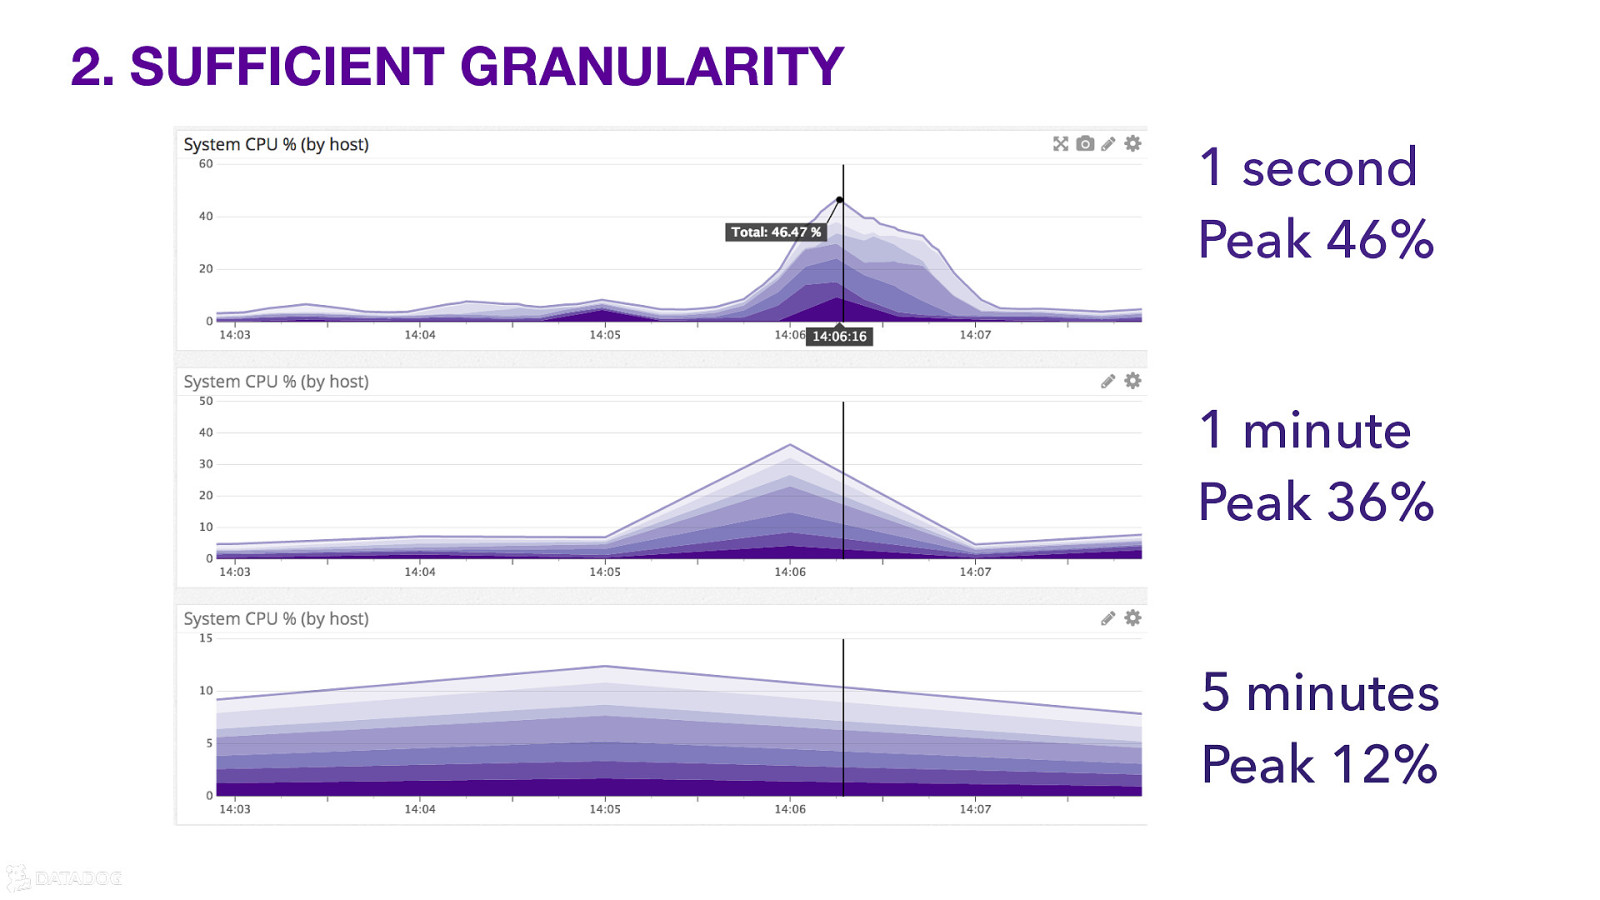
- SUFFICIENT GRANULARITY 1 second Peak 46% 1 minute Peak 36% 5 minutes Peak 12%
Slide 36
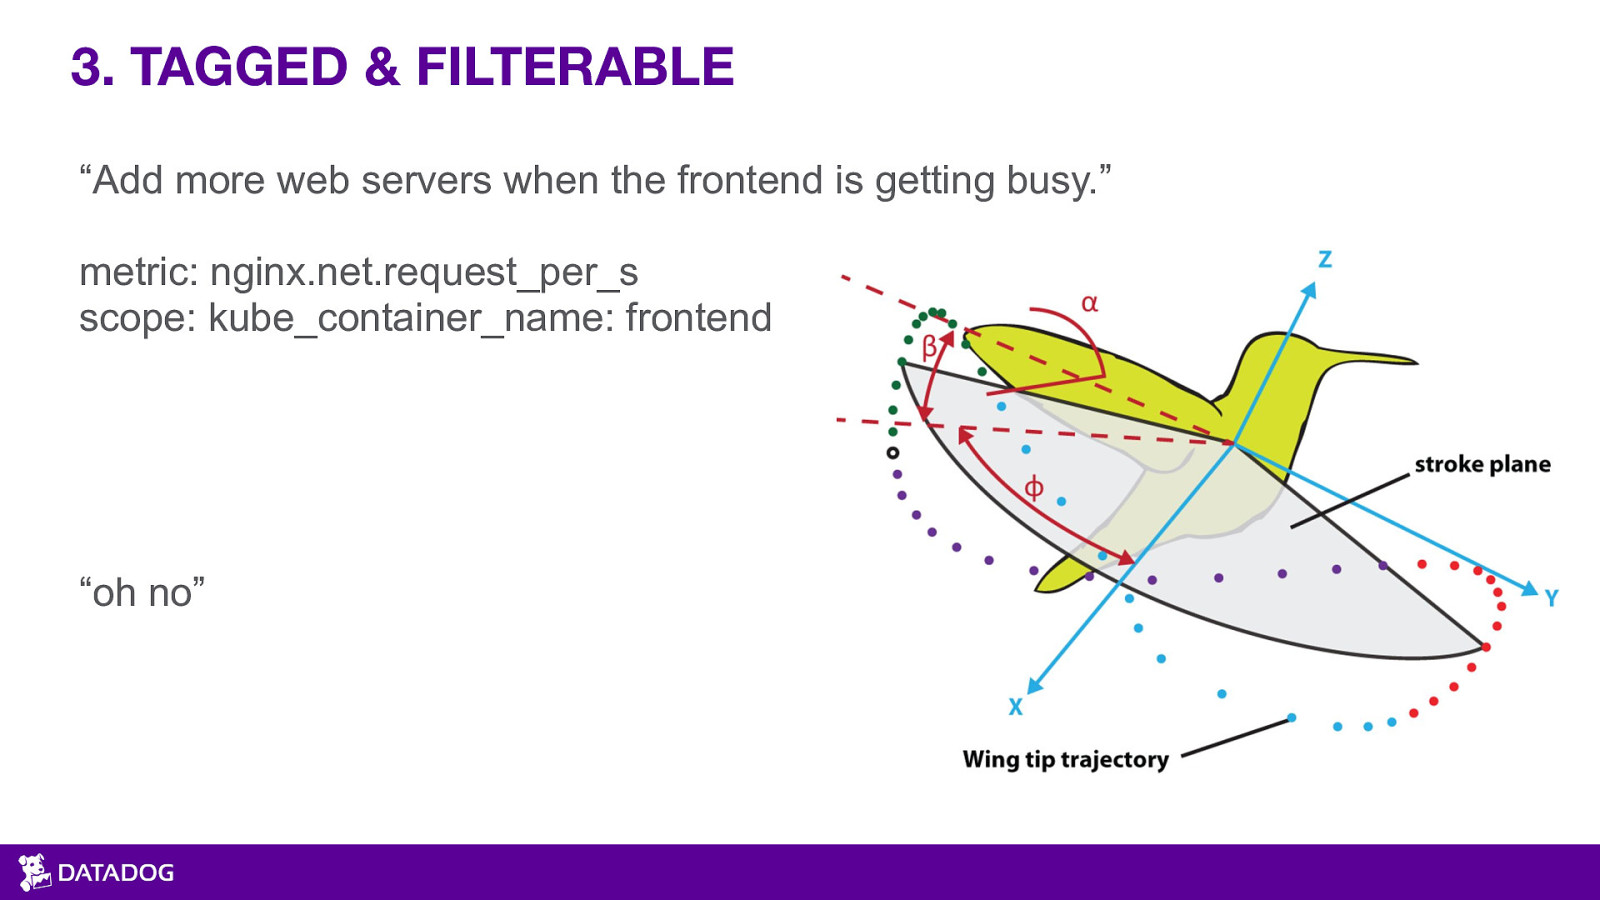
- TAGGED & FILTERABLE “Add more web servers when the frontend is getting busy.” metric: nginx.net.request_per_s scope: kube_container_name: frontend “oh no”
Slide 37
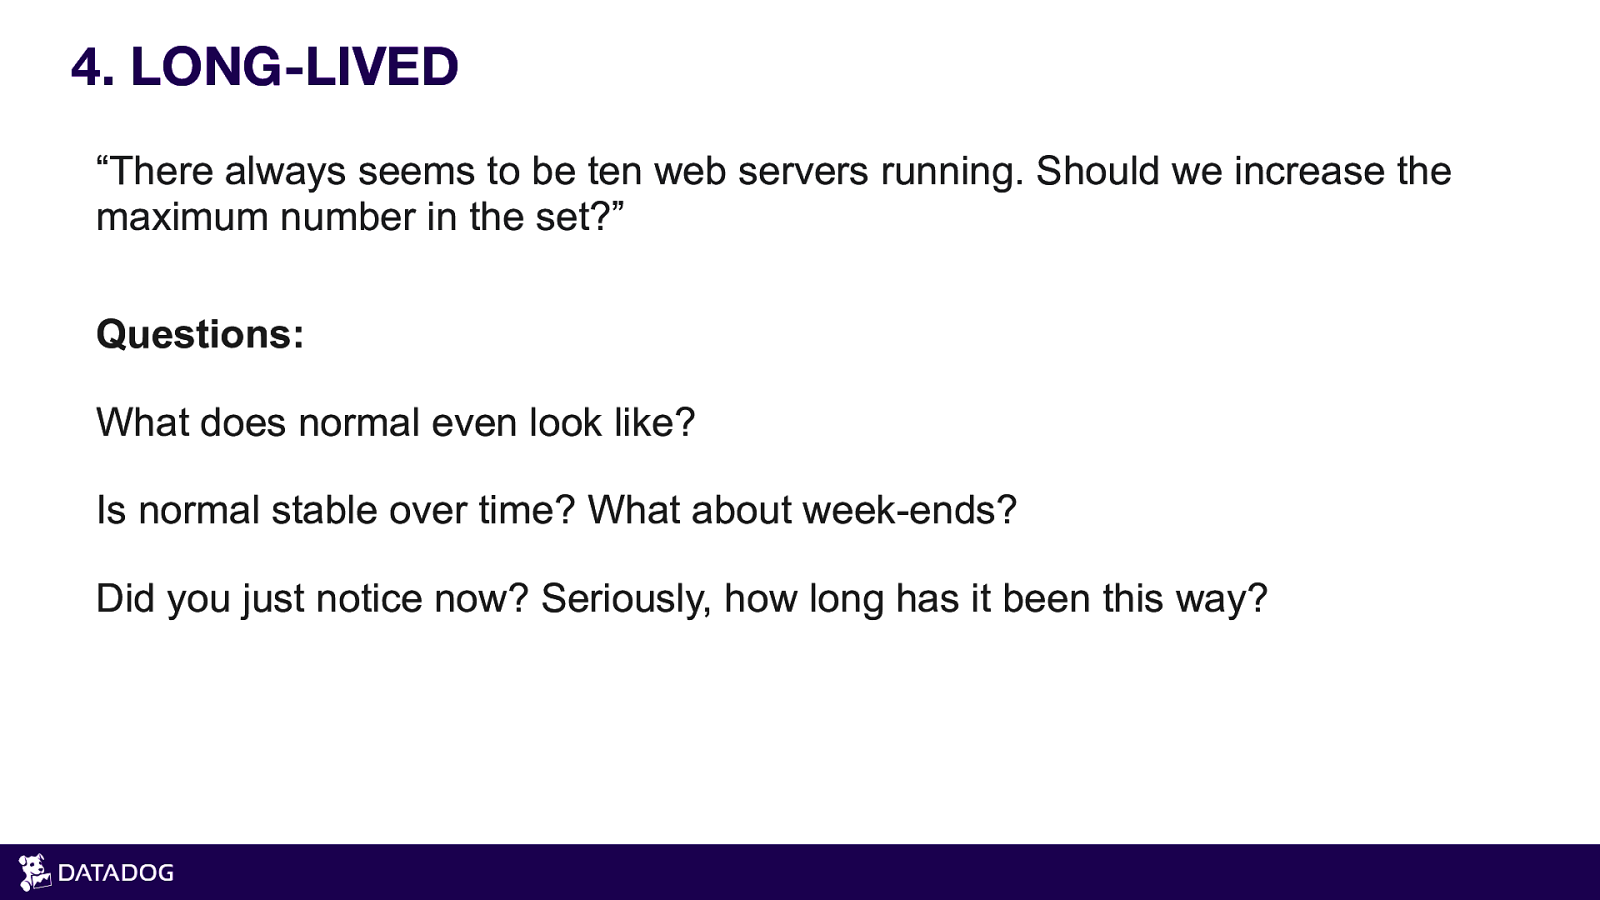
- LONG-LIVED “There always seems to be ten web servers running. Should we increase the maximum number in the set?” Questions: What does normal even look like? Is normal stable over time? What about week-ends? Did you just notice now? Seriously, how long has it been this way?
Slide 38
Slide 39
Slide 40
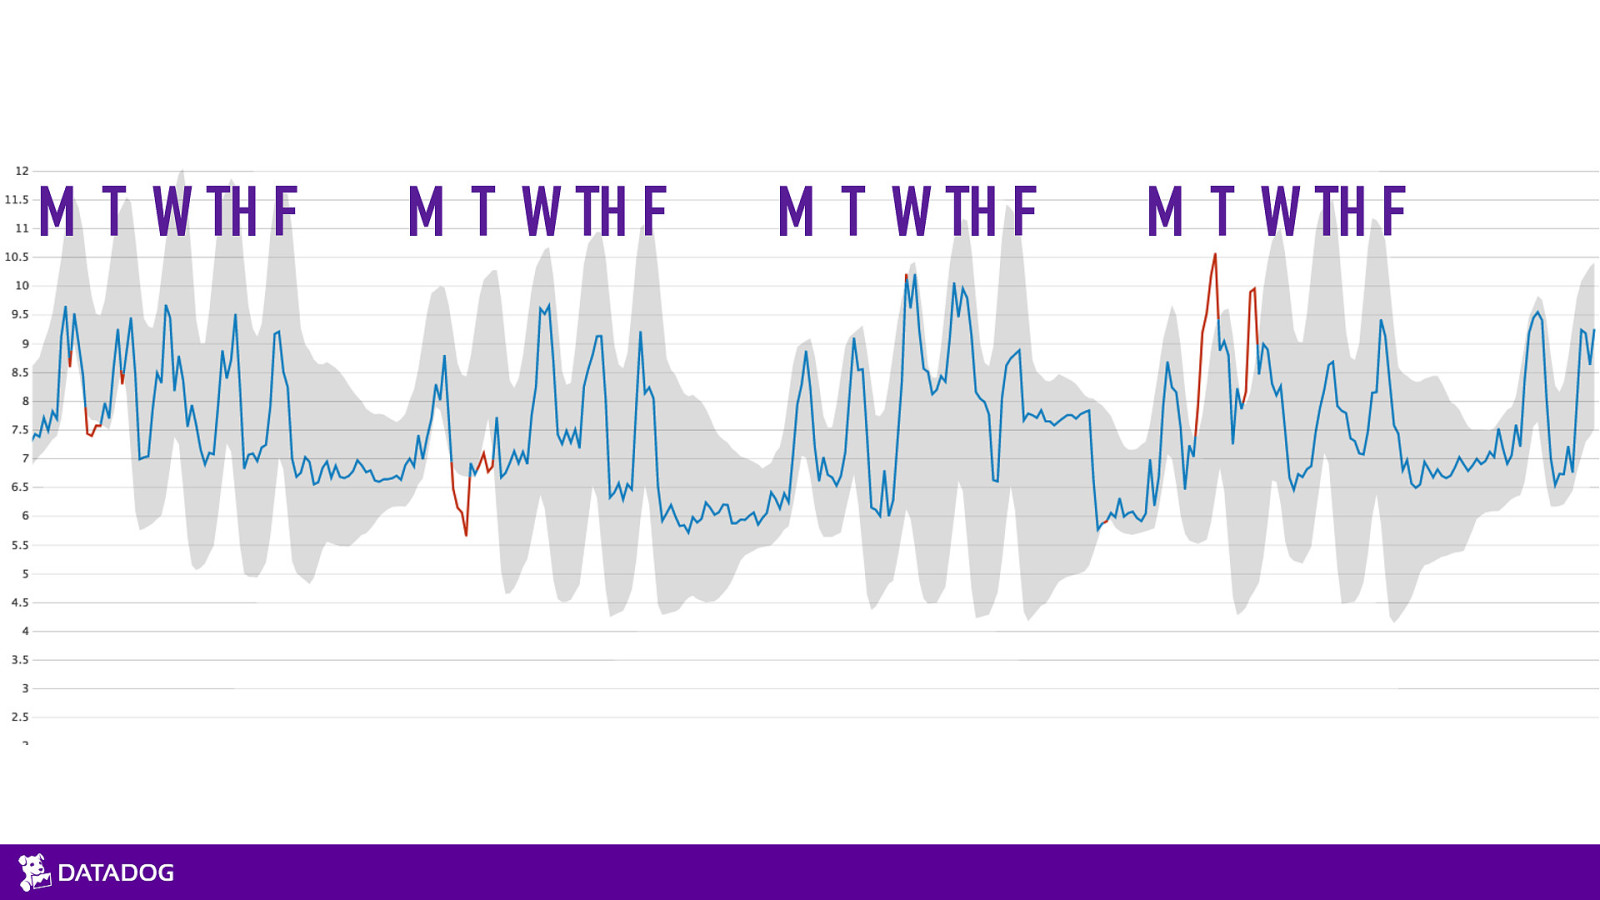
M T W TH F M T W TH F M T W TH F M T W TH F
Slide 41
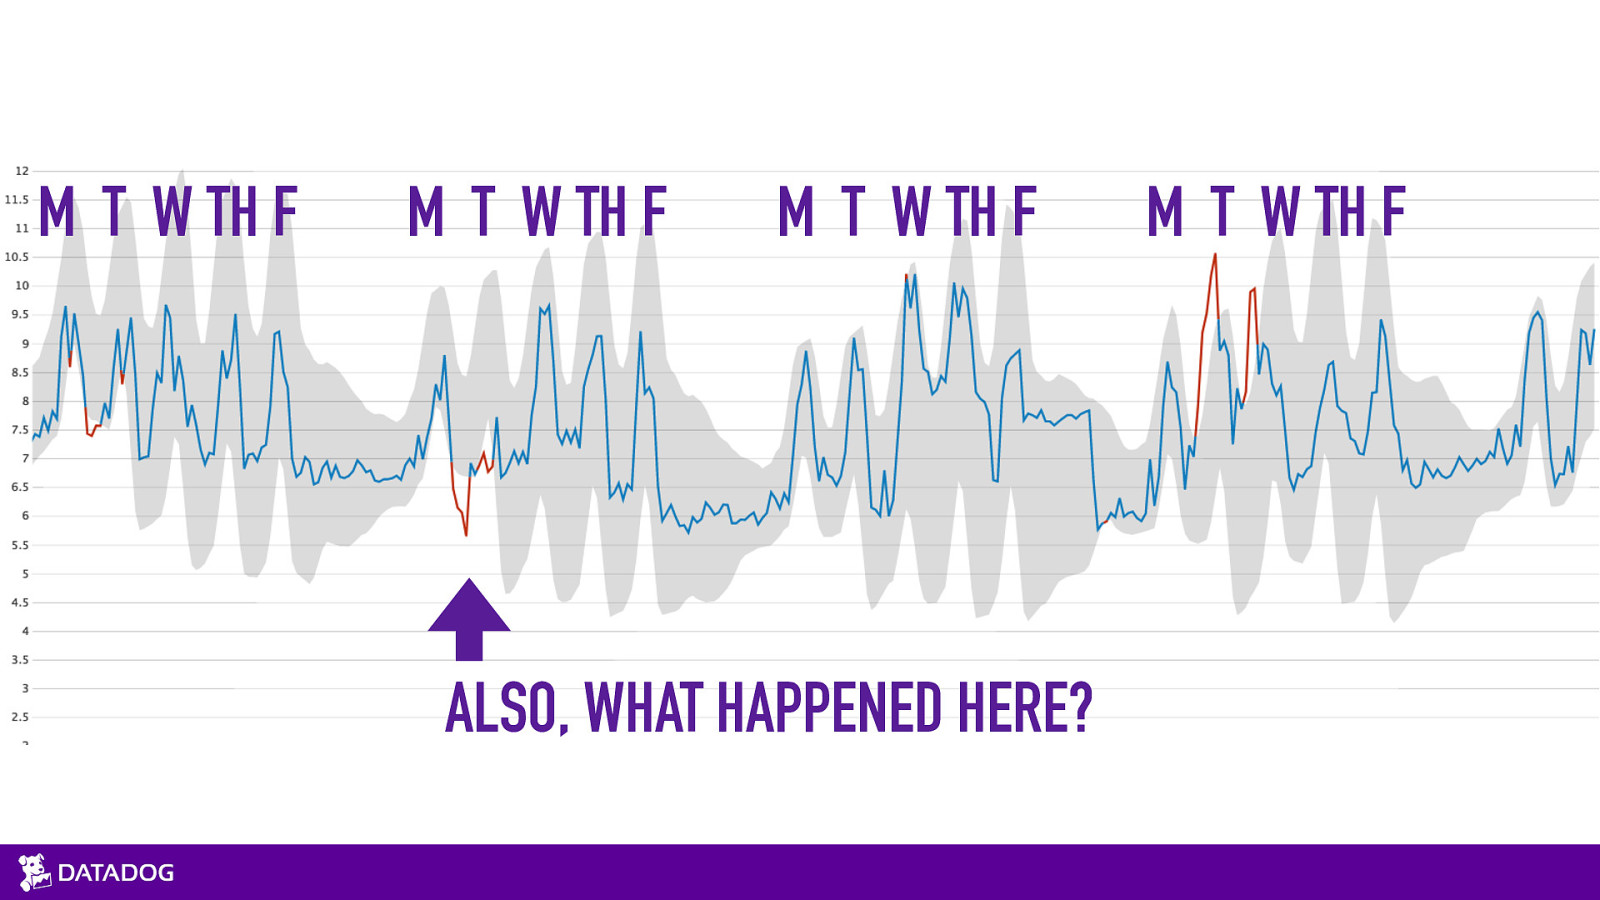
M T W TH F M T W TH F M T W TH F ALSO, WHAT HAPPENED HERE? M T W TH F
Slide 42
- TRENDS IN CONTAINERISATION 2. THE QUALITIES OF GOOD METRICS 3. SCALING KUBERNETES (W/ METRICS)
Slide 43

MERCI ! DANIEL MAHER @phrawzty daniel.maher@datadoghq.com